☰Read-only archive⌕
Looking for help with Bokeh?

This is a read-only archive. Ask questions and join the conversation on GitHub.

Visit Community Support on GitHub →
Archived discussions · Captured October 28, 2026

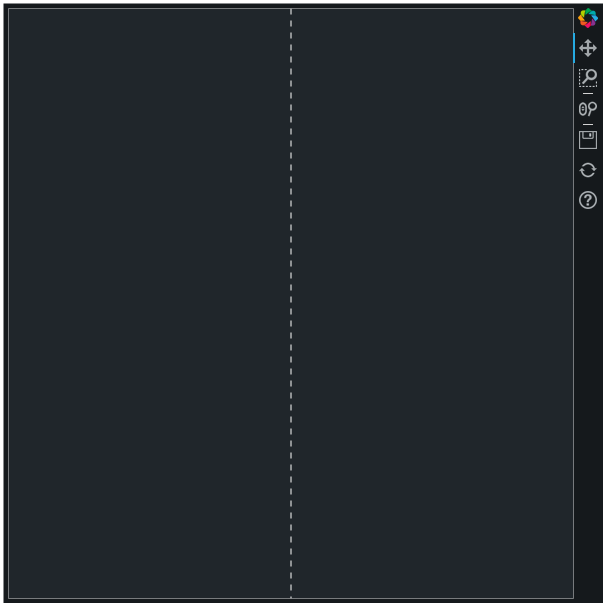
The diagram with time.struct_time data is not displayed

Community Support
PlatonB
PlatonB

Code:

import time
from bokeh.io import curdoc
from bokeh.plotting import figure, show
from bokeh.models import LinearAxis, Span

processes, seconds = [], []
for line in ['1	2:55',
             '2	2:01',
             '3	1:25',
             '4	1:09',
             '5	1:10',
             '6	1:13',
             '7	1:16',
             '8	1:10']:
        row = line.rstrip().split('\t')
        processes.append(int(row[0]))
        seconds.append(time.strptime(row[1],
                                     '%H:%M'))
curdoc().theme = 'dark_minimal'
p = figure(x_axis_label='Parallel processes',
           y_axis_label='Time',
           x_range=(0, processes[-1]))
cores_label_place = processes[-1] // 4
threads_label_place = processes[-1] - cores_label_place
p.add_layout(LinearAxis(ticker=[cores_label_place,
                                threads_label_place],
                        major_label_overrides={cores_label_place: 'CPU cores',
                                               threads_label_place: 'CPU threads'}),
             'above')
p.add_layout(Span(location=processes[-1] / 2,
                  dimension='height',
                  line_dash='dashed',
                  line_color='white'))
p.line(processes, seconds)
show(p)

Result:
Neither the main axis labels, nor the additional axis labels, nor the main line are displayed. But the span line is shown.
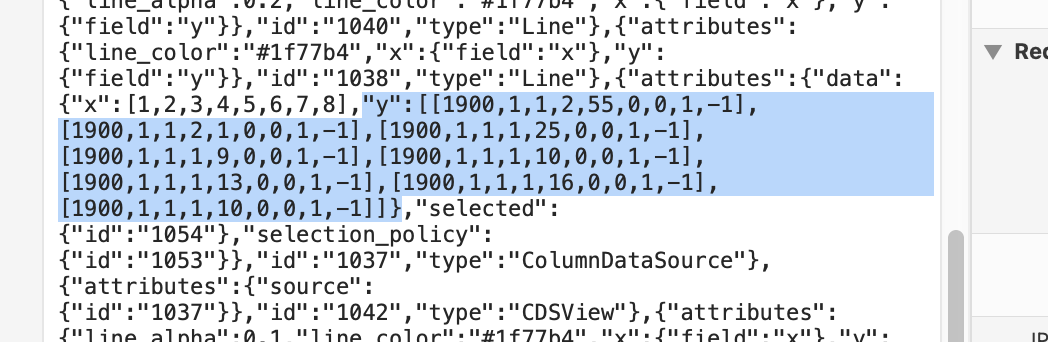
Plotted objects:
[1, 2, 3, 4, 5, 6, 7, 8]

[time.struct_time(tm_year=1900, tm_mon=1, tm_mday=1, tm_hour=2, tm_min=55, tm_sec=0, tm_wday=0, tm_yday=1, tm_isdst=-1), time.struct_time(tm_year=1900, tm_mon=1, tm_mday=1, tm_hour=2, tm_min=1, tm_sec=0, tm_wday=0, tm_yday=1, tm_isdst=-1), time.struct_time(tm_year=1900, tm_mon=1, tm_mday=1, tm_hour=1, tm_min=25, tm_sec=0, tm_wday=0, tm_yday=1, tm_isdst=-1), time.struct_time(tm_year=1900, tm_mon=1, tm_mday=1, tm_hour=1, tm_min=9, tm_sec=0, tm_wday=0, tm_yday=1, tm_isdst=-1), time.struct_time(tm_year=1900, tm_mon=1, tm_mday=1, tm_hour=1, tm_min=10, tm_sec=0, tm_wday=0, tm_yday=1, tm_isdst=-1), time.struct_time(tm_year=1900, tm_mon=1, tm_mday=1, tm_hour=1, tm_min=13, tm_sec=0, tm_wday=0, tm_yday=1, tm_isdst=-1), time.struct_time(tm_year=1900, tm_mon=1, tm_mday=1, tm_hour=1, tm_min=16, tm_sec=0, tm_wday=0, tm_yday=1, tm_isdst=-1), time.struct_time(tm_year=1900, tm_mon=1, tm_mday=1, tm_hour=1, tm_min=10, tm_sec=0, tm_wday=0, tm_yday=1, tm_isdst=-1)]

⌁   Link to post
Bryan
Bryan

@PlatonB I am not sure if Bokeh is expected to understand time objects or not[1], but clearly what is making it to the browser is not useful for BokehJS:

Bokeh datetime axes fundamentally use “milliseconds since epoch” and definitely convert datetime objects to that, as needed. I’d suggest trying those first.


  1. Either way, AFAIK you are the first person to ask about “time” objects in the last ten years, so if it does not work, I am not too surprised. Feel free to open a GitHub Issue about it. ↩︎

⌁   Link to post
PlatonB
PlatonB

Temporary solution.
I got around the problem using pandas.to_timedelta.

Working code:

import pandas as pd
from bokeh.io import curdoc
from bokeh.plotting import figure, show
from bokeh.models import LinearAxis, Span

processes = pd.Series([1, 2, 3, 4, 5, 6, 7, 8]).to_list()
time = pd.to_timedelta(pd.Series(['2h55m', '2h01m',
                                  '1h25m', '1h09m',
                                  '1h10m', '1h13m',
                                  '1h16m', '1h10m'])).to_list()
curdoc().theme = 'dark_minimal'
p = figure(x_range=(0, processes[-1]),
           y_axis_type='datetime')
cores_label_place = processes[-1] // 4
threads_label_place = processes[-1] - cores_label_place
p.add_layout(LinearAxis(ticker=[cores_label_place,
                                threads_label_place],
                        major_label_overrides={cores_label_place: 'CPU cores',
                                               threads_label_place: 'CPU threads'}),
             'above')
p.add_layout(Span(location=processes[-1] / 2,
                  dimension='height',
                  line_dash='dashed',
                  line_color='white'))
p.line(processes, time)
show(p)

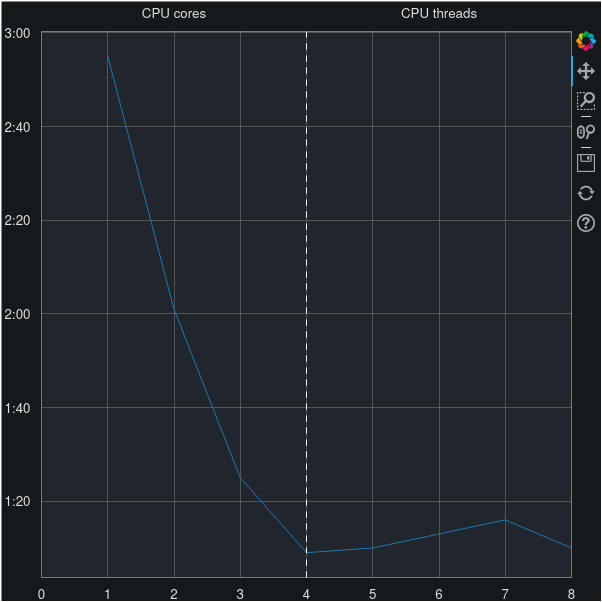
Result:

P.S.
But it would be nice if this data could be prepared with the built-in Python instruments.

⌁   Link to post
Bryan
Bryan

As I mentioned above there has been almost no detectable interest in using time objects in data sources. Your best bet to get things on the radar is to submit a detailed GitHub Issue to request support for it.

⌁   Link to post

End of archived discussion · Replies are disabled