☰Read-only archive⌕
Looking for help with Bokeh?

This is a read-only archive. Ask questions and join the conversation on GitHub.

Visit Community Support on GitHub →
Archived discussions · Captured October 28, 2026

This topic needs a title

Community Support
Sayak_Paul
Sayak_Paul

I am using the following Python code:

from bokeh.charts import Step, show, output_file, Line

build a dataset where multiple columns measure the same thing

data = dict(Uniform=[

            110.14,  678.01, 8081.62, 111.11],

        Distance=[

            108.33, 641.44, 8070.54 , 107.92],

        )

create a line chart where each column of measures receives a unique color and dash style

line = Line(data, y=[‘Uniform’, ‘Distance’],

        color=['Uniform', 'Distance'],

        xlabel = 'Different Algorithms', ylabel='Runtime (Seconds)', legend=True)

output_file(“steps.html”, title=“line.py”)

show(line)

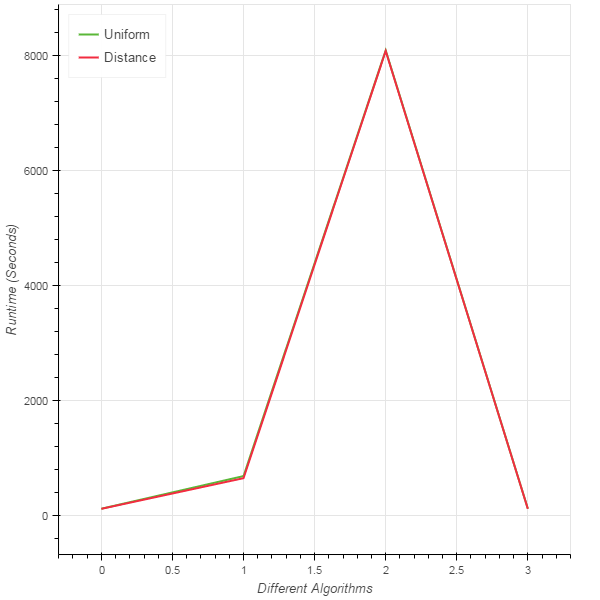
You can find the output in the attachment. I want to make the distinction of the two lines clearer.

···

Thanks and Regards,
Sayak Paul,

Placement Representative,

Department of IT,

Netaji Subhash Engineering College,

2013 - 17

Phone: +918981257929

Email-ID: spsayakpaul@gmail.com

⌁   Link to post
Sayak_Paul
Sayak_Paul

Anything on this?

Regards,
Sayak Paul

···

On Mar 11, 2017 4:47 PM, “Sayak Paul” spsayakpaul@gmail.com wrote:

I am using the following Python code:

from bokeh.charts import Step, show, output_file, Line

build a dataset where multiple columns measure the same thing

data = dict(Uniform=[

            110.14,  678.01, 8081.62, 111.11],
        Distance=[
            108.33, 641.44, 8070.54 , 107.92],
        )

create a line chart where each column of measures receives a unique color and dash style

line = Line(data, y=[‘Uniform’, ‘Distance’],

        color=['Uniform', 'Distance'],
        xlabel = 'Different Algorithms', ylabel='Runtime (Seconds)', legend=True)

output_file(“steps.html”, title=“line.py”)

show(line)

You can find the output in the attachment. I want to make the distinction of the two lines clearer.
Thanks and Regards,
Sayak Paul,

Placement Representative,

Department of IT,

Netaji Subhash Engineering College,

2013 - 17

Phone: +918981257929

Email-ID: spsayakpaul@gmail.com

–

You received this message because you are subscribed to the Google Groups “Bokeh Discussion - Public” group.

To unsubscribe from this group and stop receiving emails from it, send an email to bokeh+unsubscribe@continuum.io.

To post to this group, send email to bokeh@continuum.io.

To view this discussion on the web visit https://groups.google.com/a/continuum.io/d/msgid/bokeh/CAGa_XGHfFaixfP680VpSJ5see5bsChkBGAqrVxMLRPqfcWoHJQ%40mail.gmail.com.

For more options, visit https://groups.google.com/a/continuum.io/d/optout.

⌁   Link to post
Bryan
Bryan

Hi Sayak,

I’d suggest using the .line method from bokeh.plotting, which gives you easier access to finer grained control over things like line dashing, log axes, etc. This code does a bit better job:

from [bokeh.io](http://bokeh.io) import output_file, show
from bokeh.plotting import figure

x = [1,2,3,4]
uniform = [110.14,  678.01, 8081.62, 111.11]
distance = [108.33, 641.44, 8070.54 , 107.92]

p = figure(title='Different Algorithms', y_axis_type="log", plot_width=900, plot_height=400)
p.yaxis.axis_label = 'Runtime (Seconds)'

p.line(x, uniform, legend="Uniform", color="firebrick", alpha=0.5, line_width=5)
p.line(x, distance, legend="Distance", color="navy", line_dash="dashed", line_width=3)

output_file("foo.html")

show(p)

But mostly, I think you are just using the wrong kind of plot. If it is the difference you care about, then you should plot the difference directly, so that it’s actually what is apparent. This code:

from [bokeh.io](http://bokeh.io) import output_file, show
from bokeh.plotting import figure

x = [1,2,3,4]
uniform = [110.14,  678.01, 8081.62, 111.11]
distance = [108.33, 641.44, 8070.54 , 107.92]
delta = [x-y for x,y in zip(uniform, distance)]

p = figure(title='Different Algorithms', plot_height=400)
p.yaxis.axis_label = 'Delta Runtime (Seconds)'

p.vbar(x, top=delta, width=0.8, legend="(Uniform - Distance)")

output_file("foo.html")

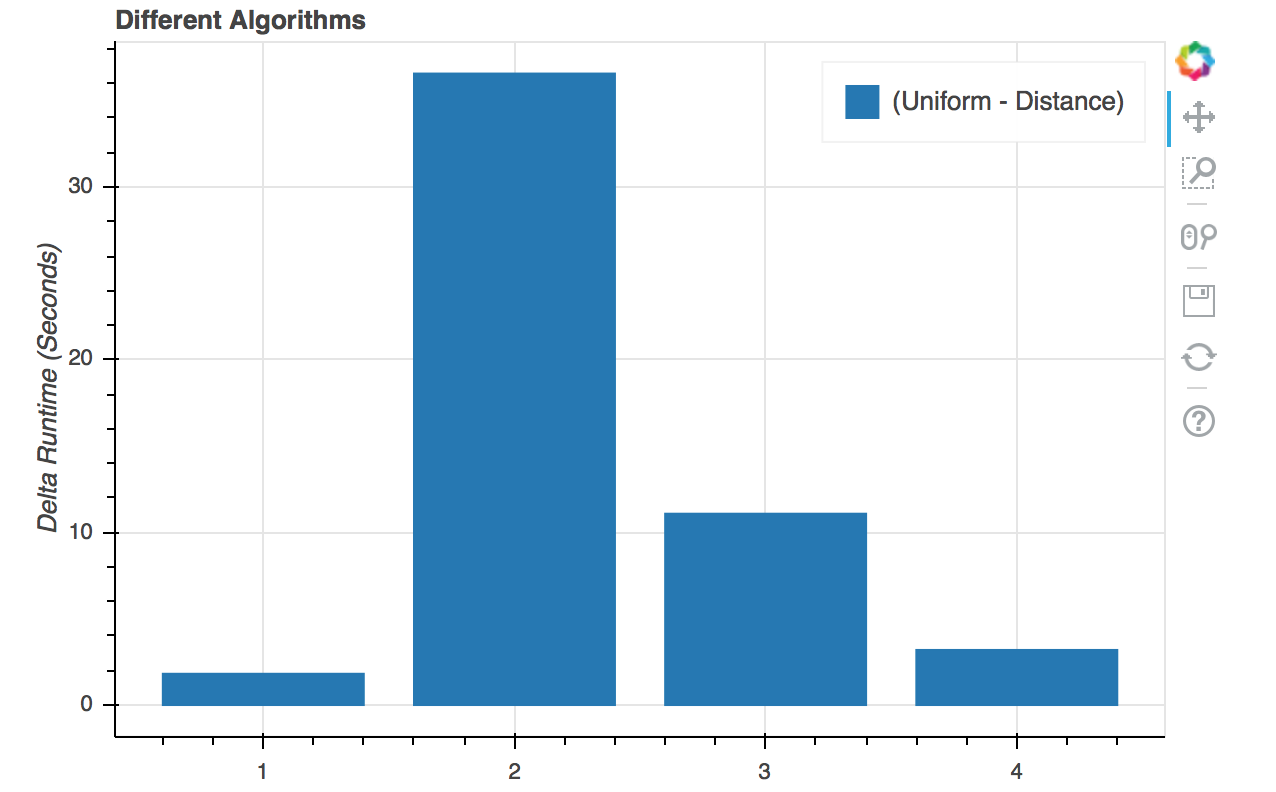
Yields the plot below, which I would consider much better if the quantity of interest is the difference:

show(p)<img apple-inline="yes" id="A504F993-BD28-4302-A69F-8FF045A0871D" width="638" height="396" src="//bokeh-discourse-uploads.s3.dualstack.us-east-1.amazonaws.com/original/1X/0eba4be10d38b3bdfb8c94dfb80877bf3c82f96b.png" class="">
···

On Mar 11, 2017, at 05:17, Sayak Paul spsayakpaul@gmail.com wrote:

I am using the following Python code:

from bokeh.charts import Step, show, output_file, Line

build a dataset where multiple columns measure the same thing

data = dict(Uniform=[
110.14, 678.01, 8081.62, 111.11],
Distance=[
108.33, 641.44, 8070.54 , 107.92],
)

create a line chart where each column of measures receives a unique color and dash style

line = Line(data, y=[‘Uniform’, ‘Distance’],

        color=['Uniform', 'Distance'],
        xlabel = 'Different Algorithms', ylabel='Runtime (Seconds)', legend=True)

output_file(“steps.html”, title=“line.py”)

show(line)

You can find the output in the attachment. I want to make the distinction of the two lines clearer.
Thanks and Regards,
Sayak Paul,
Placement Representative,
Department of IT,
Netaji Subhash Engineering College,
2013 - 17
Phone: +918981257929
Email-ID: spsayakpaul@gmail.com

–
You received this message because you are subscribed to the Google Groups “Bokeh Discussion - Public” group.
To unsubscribe from this group and stop receiving emails from it, send an email to bokeh+unsubscribe@continuum.io.
To post to this group, send email to bokeh@continuum.io.
To view this discussion on the web visit https://groups.google.com/a/continuum.io/d/msgid/bokeh/CAGa_XGHfFaixfP680VpSJ5see5bsChkBGAqrVxMLRPqfcWoHJQ%40mail.gmail.com.
For more options, visit https://groups.google.com/a/continuum.io/d/optout.
<bokeh_plot.png>

⌁   Link to post
Sayak_Paul
Sayak_Paul

But the picture does not show the distinction.

Regards,
Sayak Paul

···

On Mar 11, 2017 10:45 PM, “Bryan Van de ven” bryan@bokeh.org wrote:

Hi Sayak,

I’d suggest using the .line method from bokeh.plotting, which gives you easier access to finer grained control over things like line dashing, log axes, etc. This code does a bit better job:

from bokeh.io import output_file, show
from bokeh.plotting import figure

x = [1,2,3,4]
uniform = [110.14, 678.01, 8081.62, 111.11]
distance = [108.33, 641.44, 8070.54 , 107.92]

p = figure(title=‘Different Algorithms’, y_axis_type=“log”, plot_width=900, plot_height=400)
p.yaxis.axis_label = ‘Runtime (Seconds)’

p.line(x, uniform, legend=“Uniform”, color=“firebrick”, alpha=0.5, line_width=5)
p.line(x, distance, legend=“Distance”, color=“navy”, line_dash=“dashed”, line_width=3)

output_file(“foo.html”)

show(p)

But mostly, I think you are just using the wrong kind of plot. If it is the difference you care about, then you should plot the difference directly, so that it’s actually what is apparent. This code:

from bokeh.io import output_file, show
from bokeh.plotting import figure

x = [1,2,3,4]
uniform = [110.14, 678.01, 8081.62, 111.11]
distance = [108.33, 641.44, 8070.54 , 107.92]
delta = [x-y for x,y in zip(uniform, distance)]

p = figure(title=‘Different Algorithms’, plot_height=400)
p.yaxis.axis_label = ‘Delta Runtime (Seconds)’

p.vbar(x, top=delta, width=0.8, legend=“(Uniform - Distance)”)

output_file(“foo.html”)

Yields the plot below, which I would consider much better if the quantity of interest is the difference:

show(p)

On Mar 11, 2017, at 05:17, Sayak Paul spsayakpaul@gmail.com wrote:

I am using the following Python code:

from bokeh.charts import Step, show, output_file, Line

build a dataset where multiple columns measure the same thing

data = dict(Uniform=[
110.14, 678.01, 8081.62, 111.11],
Distance=[
108.33, 641.44, 8070.54 , 107.92],
)

create a line chart where each column of measures receives a unique color and dash style

line = Line(data, y=[‘Uniform’, ‘Distance’],

        color=['Uniform', 'Distance'],
        xlabel = 'Different Algorithms', ylabel='Runtime (Seconds)', legend=True)

output_file(“steps.html”, title=“line.py”)

show(line)

You can find the output in the attachment. I want to make the distinction of the two lines clearer.
Thanks and Regards,
Sayak Paul,
Placement Representative,
Department of IT,
Netaji Subhash Engineering College,
2013 - 17
Phone: +918981257929
Email-ID: spsayakpaul@gmail.com

–
You received this message because you are subscribed to the Google Groups “Bokeh Discussion - Public” group.
To unsubscribe from this group and stop receiving emails from it, send an email to bokeh+unsubscribe@continuum.io.
To post to this group, send email to bokeh@continuum.io.
To view this discussion on the web visit https://groups.google.com/a/continuum.io/d/msgid/bokeh/CAGa_XGHfFaixfP680VpSJ5see5bsChkBGAqrVxMLRPqfcWoHJQ%40mail.gmail.com.
For more options, visit https://groups.google.com/a/continuum.io/d/optout.
<bokeh_plot.png>

–

You received this message because you are subscribed to the Google Groups “Bokeh Discussion - Public” group.

To unsubscribe from this group and stop receiving emails from it, send an email to bokeh+unsubscribe@continuum.io.

To post to this group, send email to bokeh@continuum.io.

To view this discussion on the web visit https://groups.google.com/a/continuum.io/d/msgid/bokeh/A5B05F69-D567-4D82-BB9E-4A857302CC2E%40continuum.io.

For more options, visit https://groups.google.com/a/continuum.io/d/optout.

⌁   Link to post
Sayak_Paul
Sayak_Paul

The quantity is ofcourse the difference but I am trying to show two lines which will indeed show the distinction in one plot.

Regards,
Sayak Paul

···

On Mar 11, 2017 11:08 PM, “Sayak Paul” spsayakpaul@gmail.com wrote:

But the picture does not show the distinction.

Regards,
Sayak Paul

On Mar 11, 2017 10:45 PM, “Bryan Van de ven” bryanv@continuum.io wrote:

Hi Sayak,

I’d suggest using the .line method from bokeh.plotting, which gives you easier access to finer grained control over things like line dashing, log axes, etc. This code does a bit better job:

from bokeh.io import output_file, show
from bokeh.plotting import figure

x = [1,2,3,4]
uniform = [110.14, 678.01, 8081.62, 111.11]
distance = [108.33, 641.44, 8070.54 , 107.92]

p = figure(title=‘Different Algorithms’, y_axis_type=“log”, plot_width=900, plot_height=400)
p.yaxis.axis_label = ‘Runtime (Seconds)’

p.line(x, uniform, legend=“Uniform”, color=“firebrick”, alpha=0.5, line_width=5)
p.line(x, distance, legend=“Distance”, color=“navy”, line_dash=“dashed”, line_width=3)

output_file(“foo.html”)

show(p)

But mostly, I think you are just using the wrong kind of plot. If it is the difference you care about, then you should plot the difference directly, so that it’s actually what is apparent. This code:

from bokeh.io import output_file, show
from bokeh.plotting import figure

x = [1,2,3,4]
uniform = [110.14, 678.01, 8081.62, 111.11]
distance = [108.33, 641.44, 8070.54 , 107.92]
delta = [x-y for x,y in zip(uniform, distance)]

p = figure(title=‘Different Algorithms’, plot_height=400)
p.yaxis.axis_label = ‘Delta Runtime (Seconds)’

p.vbar(x, top=delta, width=0.8, legend=“(Uniform - Distance)”)

output_file(“foo.html”)

Yields the plot below, which I would consider much better if the quantity of interest is the difference:

show(p)

On Mar 11, 2017, at 05:17, Sayak Paul spsayakpaul@gmail.com wrote:

I am using the following Python code:

from bokeh.charts import Step, show, output_file, Line

build a dataset where multiple columns measure the same thing

data = dict(Uniform=[
110.14, 678.01, 8081.62, 111.11],
Distance=[
108.33, 641.44, 8070.54 , 107.92],
)

create a line chart where each column of measures receives a unique color and dash style

line = Line(data, y=[‘Uniform’, ‘Distance’],

        color=['Uniform', 'Distance'],
        xlabel = 'Different Algorithms', ylabel='Runtime (Seconds)', legend=True)

output_file(“steps.html”, title=“line.py”)

show(line)

You can find the output in the attachment. I want to make the distinction of the two lines clearer.
Thanks and Regards,
Sayak Paul,
Placement Representative,
Department of IT,
Netaji Subhash Engineering College,
2013 - 17
Phone: +918981257929
Email-ID: spsayakpaul@gmail.com

–
You received this message because you are subscribed to the Google Groups “Bokeh Discussion - Public” group.
To unsubscribe from this group and stop receiving emails from it, send an email to bokeh+unsubscribe@continuum.io.
To post to this group, send email to bokeh@continuum.io.
To view this discussion on the web visit https://groups.google.com/a/continuum.io/d/msgid/bokeh/CAGa_XGHfFaixfP680VpSJ5see5bsChkBGAqrVxMLRPqfcWoHJQ%40mail.gmail.com.
For more options, visit https://groups.google.com/a/continuum.io/d/optout.
<bokeh_plot.png>

–

You received this message because you are subscribed to the Google Groups “Bokeh Discussion - Public” group.

To unsubscribe from this group and stop receiving emails from it, send an email to bokeh+unsubscribe@continuum.io.

To post to this group, send email to bokeh@continuum.io.

To view this discussion on the web visit https://groups.google.com/a/continuum.io/d/msgid/bokeh/A5B05F69-D567-4D82-BB9E-4A857302CC2E%40continuum.io.

For more options, visit https://groups.google.com/a/continuum.io/d/optout.

⌁   Link to post
Bryan
Bryan

I'm not sure what you mean, the picture is *explicitly* of the differences between the two series. From your comments i inferred that this was the quantity you actually cared about, so I offered an alternative visualization that actually shows the difference. If I was incorrect in my assumption, certainly feel free to ignore my suggestion as irrelevant.

However, purely from a datives point of view, given the wide scale of y-values and the small scale of differences, I think you will struggle to find a plot that shows the lines for the series themselves, and also makes their difference stand out.

Thanks,

Bryan

···

On Mar 11, 2017, at 11:38, Sayak Paul <spsayakpaul@gmail.com> wrote:

But the picture does not show the distinction.

Regards,
Sayak Paul

On Mar 11, 2017 10:45 PM, "Bryan Van de ven" <bryan@bokeh.org> wrote:
Hi Sayak,

I'd suggest using the .line method from bokeh.plotting, which gives you easier access to finer grained control over things like line dashing, log axes, etc. This code does a bit better job:

  from bokeh.io import output_file, show
  from bokeh.plotting import figure

  x = [1,2,3,4]
  uniform = [110.14, 678.01, 8081.62, 111.11]
  distance = [108.33, 641.44, 8070.54 , 107.92]

  p = figure(title='Different Algorithms', y_axis_type="log", plot_width=900, plot_height=400)
  p.yaxis.axis_label = 'Runtime (Seconds)'

  p.line(x, uniform, legend="Uniform", color="firebrick", alpha=0.5, line_width=5)
  p.line(x, distance, legend="Distance", color="navy", line_dash="dashed", line_width=3)

  output_file("foo.html")
  
  show(p)

But mostly, I think you are just using the wrong kind of plot. If it is the difference you care about, then you should plot the difference directly, so that it's actually what is apparent. This code:

  from bokeh.io import output_file, show
  from bokeh.plotting import figure

  x = [1,2,3,4]
  uniform = [110.14, 678.01, 8081.62, 111.11]
  distance = [108.33, 641.44, 8070.54 , 107.92]
  delta = [x-y for x,y in zip(uniform, distance)]

  p = figure(title='Different Algorithms', plot_height=400)
  p.yaxis.axis_label = 'Delta Runtime (Seconds)'

  p.vbar(x, top=delta, width=0.8, legend="(Uniform - Distance)")

  output_file("foo.html")

Yields the plot below, which I would consider much better if the quantity of interest is the difference:

  show(p)<Screen Shot 2017-03-11 at 11.13.08.png>

On Mar 11, 2017, at 05:17, Sayak Paul <spsayakpaul@gmail.com> wrote:

I am using the following Python code:

from bokeh.charts import Step, show, output_file, Line

# build a dataset where multiple columns measure the same thing
data = dict(Uniform=[
                110.14, 678.01, 8081.62, 111.11],
            Distance=[
                108.33, 641.44, 8070.54 , 107.92],
            )

# create a line chart where each column of measures receives a unique color and dash style
line = Line(data, y=['Uniform', 'Distance'],
           
            color=['Uniform', 'Distance'],
            xlabel = 'Different Algorithms', ylabel='Runtime (Seconds)', legend=True)

output_file("steps.html", title="line.py")

show(line)

You can find the output in the attachment. I want to make the distinction of the two lines clearer.
Thanks and Regards,
Sayak Paul,
Placement Representative,
Department of IT,
Netaji Subhash Engineering College,
2013 - 17
Phone: +918981257929
Email-ID: spsayakpaul@gmail.com

--
You received this message because you are subscribed to the Google Groups "Bokeh Discussion - Public" group.
To unsubscribe from this group and stop receiving emails from it, send an email to bokeh+unsubscribe@continuum.io.
To post to this group, send email to bokeh@continuum.io.
To view this discussion on the web visit https://groups.google.com/a/continuum.io/d/msgid/bokeh/CAGa_XGHfFaixfP680VpSJ5see5bsChkBGAqrVxMLRPqfcWoHJQ%40mail.gmail.com\.
For more options, visit https://groups.google.com/a/continuum.io/d/optout\.
<bokeh_plot.png>

--
You received this message because you are subscribed to the Google Groups "Bokeh Discussion - Public" group.
To unsubscribe from this group and stop receiving emails from it, send an email to bokeh+unsubscribe@continuum.io.
To post to this group, send email to bokeh@continuum.io.
To view this discussion on the web visit https://groups.google.com/a/continuum.io/d/msgid/bokeh/A5B05F69-D567-4D82-BB9E-4A857302CC2E%40continuum.io\.
For more options, visit https://groups.google.com/a/continuum.io/d/optout\.

--
You received this message because you are subscribed to the Google Groups "Bokeh Discussion - Public" group.
To unsubscribe from this group and stop receiving emails from it, send an email to bokeh+unsubscribe@continuum.io.
To post to this group, send email to bokeh@continuum.io.
To view this discussion on the web visit https://groups.google.com/a/continuum.io/d/msgid/bokeh/CAGa_XGEmKwqUuNa3fftyEa9X0KhsfRr7iiPHzVWE3mWkFyShFQ%40mail.gmail.com\.
For more options, visit https://groups.google.com/a/continuum.io/d/optout\.

⌁   Link to post
Bryan
Bryan

In that case the other code with the log axis and the differently styled lines was the best I could come up with. Again, on the full scale of the y-range, the series are not actually very different, so showing them series themselves on the full y scale will make highlighting the difference extremely difficult.

Bryan

···

On Mar 11, 2017, at 11:42, Sayak Paul <spsayakpaul@gmail.com> wrote:

The quantity is ofcourse the difference but I am trying to show two lines which will indeed show the distinction in one plot.

Regards,
Sayak Paul

On Mar 11, 2017 11:08 PM, "Sayak Paul" <spsayakpaul@gmail.com> wrote:
But the picture does not show the distinction.

Regards,
Sayak Paul

On Mar 11, 2017 10:45 PM, "Bryan Van de ven" <bryan@bokeh.org> wrote:
Hi Sayak,

I'd suggest using the .line method from bokeh.plotting, which gives you easier access to finer grained control over things like line dashing, log axes, etc. This code does a bit better job:

  from bokeh.io import output_file, show
  from bokeh.plotting import figure

  x = [1,2,3,4]
  uniform = [110.14, 678.01, 8081.62, 111.11]
  distance = [108.33, 641.44, 8070.54 , 107.92]

  p = figure(title='Different Algorithms', y_axis_type="log", plot_width=900, plot_height=400)
  p.yaxis.axis_label = 'Runtime (Seconds)'

  p.line(x, uniform, legend="Uniform", color="firebrick", alpha=0.5, line_width=5)
  p.line(x, distance, legend="Distance", color="navy", line_dash="dashed", line_width=3)

  output_file("foo.html")
  
  show(p)

But mostly, I think you are just using the wrong kind of plot. If it is the difference you care about, then you should plot the difference directly, so that it's actually what is apparent. This code:

  from bokeh.io import output_file, show
  from bokeh.plotting import figure

  x = [1,2,3,4]
  uniform = [110.14, 678.01, 8081.62, 111.11]
  distance = [108.33, 641.44, 8070.54 , 107.92]
  delta = [x-y for x,y in zip(uniform, distance)]

  p = figure(title='Different Algorithms', plot_height=400)
  p.yaxis.axis_label = 'Delta Runtime (Seconds)'

  p.vbar(x, top=delta, width=0.8, legend="(Uniform - Distance)")

  output_file("foo.html")

Yields the plot below, which I would consider much better if the quantity of interest is the difference:

  show(p)<Screen Shot 2017-03-11 at 11.13.08.png>

On Mar 11, 2017, at 05:17, Sayak Paul <spsayakpaul@gmail.com> wrote:

I am using the following Python code:

from bokeh.charts import Step, show, output_file, Line

# build a dataset where multiple columns measure the same thing
data = dict(Uniform=[
                110.14, 678.01, 8081.62, 111.11],
            Distance=[
                108.33, 641.44, 8070.54 , 107.92],
            )

# create a line chart where each column of measures receives a unique color and dash style
line = Line(data, y=['Uniform', 'Distance'],
           
            color=['Uniform', 'Distance'],
            xlabel = 'Different Algorithms', ylabel='Runtime (Seconds)', legend=True)

output_file("steps.html", title="line.py")

show(line)

You can find the output in the attachment. I want to make the distinction of the two lines clearer.
Thanks and Regards,
Sayak Paul,
Placement Representative,
Department of IT,
Netaji Subhash Engineering College,
2013 - 17
Phone: +918981257929
Email-ID: spsayakpaul@gmail.com

--
You received this message because you are subscribed to the Google Groups "Bokeh Discussion - Public" group.
To unsubscribe from this group and stop receiving emails from it, send an email to bokeh+unsubscribe@continuum.io.
To post to this group, send email to bokeh@continuum.io.
To view this discussion on the web visit https://groups.google.com/a/continuum.io/d/msgid/bokeh/CAGa_XGHfFaixfP680VpSJ5see5bsChkBGAqrVxMLRPqfcWoHJQ%40mail.gmail.com\.
For more options, visit https://groups.google.com/a/continuum.io/d/optout\.
<bokeh_plot.png>

--
You received this message because you are subscribed to the Google Groups "Bokeh Discussion - Public" group.
To unsubscribe from this group and stop receiving emails from it, send an email to bokeh+unsubscribe@continuum.io.
To post to this group, send email to bokeh@continuum.io.
To view this discussion on the web visit https://groups.google.com/a/continuum.io/d/msgid/bokeh/A5B05F69-D567-4D82-BB9E-4A857302CC2E%40continuum.io\.
For more options, visit https://groups.google.com/a/continuum.io/d/optout\.

--
You received this message because you are subscribed to the Google Groups "Bokeh Discussion - Public" group.
To unsubscribe from this group and stop receiving emails from it, send an email to bokeh+unsubscribe@continuum.io.
To post to this group, send email to bokeh@continuum.io.
To view this discussion on the web visit https://groups.google.com/a/continuum.io/d/msgid/bokeh/CAGa_XGE6%3DtOgehEx713h681NwYb3fps46ZPRfka2gOufGxCCXg%40mail.gmail.com\.
For more options, visit https://groups.google.com/a/continuum.io/d/optout\.

⌁   Link to post
Sayak_Paul
Sayak_Paul

I see. The wide difference is causing me the issue here. I will try out your solution and let you know. Thanks.

Regards,
Sayak Paul

···

On Mar 11, 2017 11:13 PM, “Bryan Van de ven” bryanv@continuum.io wrote:

I’m not sure what you mean, the picture is explicitly of the differences between the two series. From your comments i inferred that this was the quantity you actually cared about, so I offered an alternative visualization that actually shows the difference. If I was incorrect in my assumption, certainly feel free to ignore my suggestion as irrelevant.

However, purely from a datives point of view, given the wide scale of y-values and the small scale of differences, I think you will struggle to find a plot that shows the lines for the series themselves, and also makes their difference stand out.

Thanks,

Bryan

On Mar 11, 2017, at 11:38, Sayak Paul spsayakpaul@gmail.com wrote:

But the picture does not show the distinction.

Regards,

Sayak Paul

On Mar 11, 2017 10:45 PM, “Bryan Van de ven” bryan@bokeh.org wrote:

Hi Sayak,

I’d suggest using the .line method from bokeh.plotting, which gives you easier access to finer grained control over things like line dashing, log axes, etc. This code does a bit better job:

  from [bokeh.io](http://bokeh.io) import output_file, show
  from bokeh.plotting import figure
  x = [1,2,3,4]
  uniform = [110.14,  678.01, 8081.62, 111.11]
  distance = [108.33, 641.44, 8070.54 , 107.92]
  p = figure(title='Different Algorithms', y_axis_type="log", plot_width=900, plot_height=400)
  p.yaxis.axis_label = 'Runtime (Seconds)'
  p.line(x, uniform, legend="Uniform", color="firebrick", alpha=0.5, line_width=5)
  p.line(x, distance, legend="Distance", color="navy", line_dash="dashed", line_width=3)
  output_file("foo.html")
  show(p)

But mostly, I think you are just using the wrong kind of plot. If it is the difference you care about, then you should plot the difference directly, so that it’s actually what is apparent. This code:

  from [bokeh.io](http://bokeh.io) import output_file, show
  from bokeh.plotting import figure
  x = [1,2,3,4]
  uniform = [110.14,  678.01, 8081.62, 111.11]
  distance = [108.33, 641.44, 8070.54 , 107.92]
  delta = [x-y for x,y in zip(uniform, distance)]
  p = figure(title='Different Algorithms', plot_height=400)
  p.yaxis.axis_label = 'Delta Runtime (Seconds)'
  p.vbar(x, top=delta, width=0.8, legend="(Uniform - Distance)")
  output_file("foo.html")

Yields the plot below, which I would consider much better if the quantity of interest is the difference:

  show(p)<Screen Shot 2017-03-11 at 11.13.08.png>

On Mar 11, 2017, at 05:17, Sayak Paul spsayakpaul@gmail.com wrote:

I am using the following Python code:

from bokeh.charts import Step, show, output_file, Line

build a dataset where multiple columns measure the same thing

data = dict(Uniform=[

            110.14,  678.01, 8081.62, 111.11],
        Distance=[
            108.33, 641.44, 8070.54 , 107.92],
        )

create a line chart where each column of measures receives a unique color and dash style

line = Line(data, y=[‘Uniform’, ‘Distance’],

        color=['Uniform', 'Distance'],
        xlabel = 'Different Algorithms', ylabel='Runtime (Seconds)', legend=True)

output_file(“steps.html”, title=“line.py”)

show(line)

You can find the output in the attachment. I want to make the distinction of the two lines clearer.

Thanks and Regards,

Sayak Paul,

Placement Representative,

Department of IT,

Netaji Subhash Engineering College,

2013 - 17

Phone: +918981257929

Email-ID: spsayakpaul@gmail.com

–

You received this message because you are subscribed to the Google Groups “Bokeh Discussion - Public” group.

To unsubscribe from this group and stop receiving emails from it, send an email to bokeh+unsubscribe@continuum.io.

To post to this group, send email to bokeh@continuum.io.

To view this discussion on the web visit https://groups.google.com/a/continuum.io/d/msgid/bokeh/CAGa_XGHfFaixfP680VpSJ5see5bsChkBGAqrVxMLRPqfcWoHJQ%40mail.gmail.com.

For more options, visit https://groups.google.com/a/continuum.io/d/optout.

<bokeh_plot.png>

–

You received this message because you are subscribed to the Google Groups “Bokeh Discussion - Public” group.

To unsubscribe from this group and stop receiving emails from it, send an email to bokeh+unsubscribe@continuum.io.

To post to this group, send email to bokeh@continuum.io.

To view this discussion on the web visit https://groups.google.com/a/continuum.io/d/msgid/bokeh/A5B05F69-D567-4D82-BB9E-4A857302CC2E%40continuum.io.

For more options, visit https://groups.google.com/a/continuum.io/d/optout.

–

You received this message because you are subscribed to the Google Groups “Bokeh Discussion - Public” group.

To unsubscribe from this group and stop receiving emails from it, send an email to bokeh+unsubscribe@continuum.io.

To post to this group, send email to bokeh@continuum.io.

To view this discussion on the web visit https://groups.google.com/a/continuum.io/d/msgid/bokeh/CAGa_XGEmKwqUuNa3fftyEa9X0KhsfRr7iiPHzVWE3mWkFyShFQ%40mail.gmail.com.

For more options, visit https://groups.google.com/a/continuum.io/d/optout.

–

You received this message because you are subscribed to the Google Groups “Bokeh Discussion - Public” group.

To unsubscribe from this group and stop receiving emails from it, send an email to bokeh+unsubscribe@continuum.io.

To post to this group, send email to bokeh@continuum.io.

To view this discussion on the web visit https://groups.google.com/a/continuum.io/d/msgid/bokeh/BC32FE8D-C366-48BF-920F-92B73227DB46%40continuum.io.

For more options, visit https://groups.google.com/a/continuum.io/d/optout.

⌁   Link to post
Sayak_Paul
Sayak_Paul

This did my work. Thanks. I would to site Bokeh in my paper. How should I do that?

···

On Sat, Mar 11, 2017 at 10:45 PM, Bryan Van de ven bryan@bokeh.org wrote:

Hi Sayak,

I’d suggest using the .line method from bokeh.plotting, which gives you easier access to finer grained control over things like line dashing, log axes, etc. This code does a bit better job:

from bokeh.io import output_file, show
from bokeh.plotting import figure

x = [1,2,3,4]
uniform = [110.14, 678.01, 8081.62, 111.11]
distance = [108.33, 641.44, 8070.54 , 107.92]

p = figure(title=‘Different Algorithms’, y_axis_type=“log”, plot_width=900, plot_height=400)
p.yaxis.axis_label = ‘Runtime (Seconds)’

p.line(x, uniform, legend=“Uniform”, color=“firebrick”, alpha=0.5, line_width=5)
p.line(x, distance, legend=“Distance”, color=“navy”, line_dash=“dashed”, line_width=3)

output_file(“foo.html”)

show(p)

But mostly, I think you are just using the wrong kind of plot. If it is the difference you care about, then you should plot the difference directly, so that it’s actually what is apparent. This code:

from bokeh.io import output_file, show
from bokeh.plotting import figure

x = [1,2,3,4]
uniform = [110.14, 678.01, 8081.62, 111.11]
distance = [108.33, 641.44, 8070.54 , 107.92]
delta = [x-y for x,y in zip(uniform, distance)]

p = figure(title=‘Different Algorithms’, plot_height=400)
p.yaxis.axis_label = ‘Delta Runtime (Seconds)’

p.vbar(x, top=delta, width=0.8, legend=“(Uniform - Distance)”)

output_file(“foo.html”)

Yields the plot below, which I would consider much better if the quantity of interest is the difference:

show(p)

On Mar 11, 2017, at 05:17, Sayak Paul spsayakpaul@gmail.com wrote:

I am using the following Python code:

from bokeh.charts import Step, show, output_file, Line

build a dataset where multiple columns measure the same thing

data = dict(Uniform=[
110.14, 678.01, 8081.62, 111.11],
Distance=[
108.33, 641.44, 8070.54 , 107.92],
)

create a line chart where each column of measures receives a unique color and dash style

line = Line(data, y=[‘Uniform’, ‘Distance’],

        color=['Uniform', 'Distance'],
        xlabel = 'Different Algorithms', ylabel='Runtime (Seconds)', legend=True)

output_file(“steps.html”, title=“line.py”)

show(line)

You can find the output in the attachment. I want to make the distinction of the two lines clearer.
Thanks and Regards,
Sayak Paul,
Placement Representative,
Department of IT,
Netaji Subhash Engineering College,
2013 - 17
Phone: +918981257929
Email-ID: spsayakpaul@gmail.com

–
You received this message because you are subscribed to the Google Groups “Bokeh Discussion - Public” group.
To unsubscribe from this group and stop receiving emails from it, send an email to bokeh+unsubscribe@continuum.io.
To post to this group, send email to bokeh@continuum.io.
To view this discussion on the web visit https://groups.google.com/a/continuum.io/d/msgid/bokeh/CAGa_XGHfFaixfP680VpSJ5see5bsChkBGAqrVxMLRPqfcWoHJQ%40mail.gmail.com.
For more options, visit https://groups.google.com/a/continuum.io/d/optout.

<bokeh_plot.png>

–

You received this message because you are subscribed to the Google Groups “Bokeh Discussion - Public” group.

To unsubscribe from this group and stop receiving emails from it, send an email to bokeh+unsubscribe@continuum.io.

To post to this group, send email to bokeh@continuum.io.

To view this discussion on the web visit https://groups.google.com/a/continuum.io/d/msgid/bokeh/A5B05F69-D567-4D82-BB9E-4A857302CC2E%40continuum.io.

For more options, visit https://groups.google.com/a/continuum.io/d/optout.

Thanks and Regards,
Sayak Paul

⌁   Link to post
Sayak_Paul
Sayak_Paul

Thanks. Thanks for all the support.

Regards,
Sayak Paul

···

On Mar 13, 2017 2:02 AM, “Bryan Van de ven” bryanv@continuum.io wrote:

Hi,

I am glad to hear it worked for you. All we have currently is described here:

    [http://bokehplots.com/pages/citation.html](http://bokehplots.com/pages/citation.html)

If there are better ways to cite software projects any suggestions are welcome.

Thanks,

Bryan

On Mar 11, 2017, at 22:33, Sayak Paul spsayakpaul@gmail.com wrote:

This did my work. Thanks. I would to site Bokeh in my paper. How should I do that?

Thanks and Regards,

Sayak Paul

On Sat, Mar 11, 2017 at 10:45 PM, Bryan Van de ven bryan@bokeh.org wrote:

Hi Sayak,

I’d suggest using the .line method from bokeh.plotting, which gives you easier access to finer grained control over things like line dashing, log axes, etc. This code does a bit better job:

  from [bokeh.io](http://bokeh.io) import output_file, show
  from bokeh.plotting import figure
  x = [1,2,3,4]
  uniform = [110.14,  678.01, 8081.62, 111.11]
  distance = [108.33, 641.44, 8070.54 , 107.92]
  p = figure(title='Different Algorithms', y_axis_type="log", plot_width=900, plot_height=400)
  p.yaxis.axis_label = 'Runtime (Seconds)'
  p.line(x, uniform, legend="Uniform", color="firebrick", alpha=0.5, line_width=5)
  p.line(x, distance, legend="Distance", color="navy", line_dash="dashed", line_width=3)
  output_file("foo.html")
  show(p)

But mostly, I think you are just using the wrong kind of plot. If it is the difference you care about, then you should plot the difference directly, so that it’s actually what is apparent. This code:

  from [bokeh.io](http://bokeh.io) import output_file, show
  from bokeh.plotting import figure
  x = [1,2,3,4]
  uniform = [110.14,  678.01, 8081.62, 111.11]
  distance = [108.33, 641.44, 8070.54 , 107.92]
  delta = [x-y for x,y in zip(uniform, distance)]
  p = figure(title='Different Algorithms', plot_height=400)
  p.yaxis.axis_label = 'Delta Runtime (Seconds)'
  p.vbar(x, top=delta, width=0.8, legend="(Uniform - Distance)")
  output_file("foo.html")

Yields the plot below, which I would consider much better if the quantity of interest is the difference:

  show(p)<Screen Shot 2017-03-11 at 11.13.08.png>

On Mar 11, 2017, at 05:17, Sayak Paul spsayakpaul@gmail.com wrote:

I am using the following Python code:

from bokeh.charts import Step, show, output_file, Line

build a dataset where multiple columns measure the same thing

data = dict(Uniform=[

            110.14,  678.01, 8081.62, 111.11],
        Distance=[
            108.33, 641.44, 8070.54 , 107.92],
        )

create a line chart where each column of measures receives a unique color and dash style

line = Line(data, y=[‘Uniform’, ‘Distance’],

        color=['Uniform', 'Distance'],
        xlabel = 'Different Algorithms', ylabel='Runtime (Seconds)', legend=True)

output_file(“steps.html”, title=“line.py”)

show(line)

You can find the output in the attachment. I want to make the distinction of the two lines clearer.

Thanks and Regards,

Sayak Paul,

Placement Representative,

Department of IT,

Netaji Subhash Engineering College,

2013 - 17

Phone: +918981257929

Email-ID: spsayakpaul@gmail.com

–

You received this message because you are subscribed to the Google Groups “Bokeh Discussion - Public” group.

To unsubscribe from this group and stop receiving emails from it, send an email to bokeh+unsubscribe@continuum.io.

To post to this group, send email to bokeh@continuum.io.

To view this discussion on the web visit https://groups.google.com/a/continuum.io/d/msgid/bokeh/CAGa_XGHfFaixfP680VpSJ5see5bsChkBGAqrVxMLRPqfcWoHJQ%40mail.gmail.com.

For more options, visit https://groups.google.com/a/continuum.io/d/optout.

<bokeh_plot.png>

–

You received this message because you are subscribed to the Google Groups “Bokeh Discussion - Public” group.

To unsubscribe from this group and stop receiving emails from it, send an email to bokeh+unsubscribe@continuum.io.

To post to this group, send email to bokeh@continuum.io.

To view this discussion on the web visit https://groups.google.com/a/continuum.io/d/msgid/bokeh/A5B05F69-D567-4D82-BB9E-4A857302CC2E%40continuum.io.

For more options, visit https://groups.google.com/a/continuum.io/d/optout.

–

You received this message because you are subscribed to the Google Groups “Bokeh Discussion - Public” group.

To unsubscribe from this group and stop receiving emails from it, send an email to bokeh+unsubscribe@continuum.io.

To post to this group, send email to bokeh@continuum.io.

To view this discussion on the web visit https://groups.google.com/a/continuum.io/d/msgid/bokeh/CAGa_XGHKXivEaeo7Q4dOKGCQmAYB6kVeAz9v_S7Txn6y57%2Brtw%40mail.gmail.com.

For more options, visit https://groups.google.com/a/continuum.io/d/optout.

–

You received this message because you are subscribed to the Google Groups “Bokeh Discussion - Public” group.

To unsubscribe from this group and stop receiving emails from it, send an email to bokeh+unsubscribe@continuum.io.

To post to this group, send email to bokeh@continuum.io.

To view this discussion on the web visit https://groups.google.com/a/continuum.io/d/msgid/bokeh/426DD02E-FCDE-4057-82E9-C393945035E1%40continuum.io.

For more options, visit https://groups.google.com/a/continuum.io/d/optout.

⌁   Link to post

End of archived discussion · Replies are disabled