Hello,
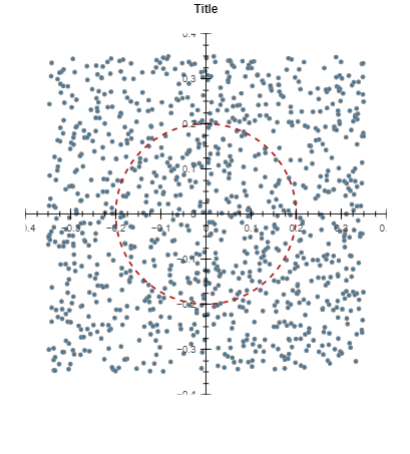
I am getting started with Bokeh to automate plot generation but I am stuck with the tick labels not being shown.
I tried playing around with the plot dimensions and also the frame dimensions.
None of my approaches work.
How can I set the range of both axis with the labels being shown (0.4 and -0.4 in this case).
Code below thanks
def single_orb_plot(acc_x, acc_y, title, radius):

    p = figure(toolbar_location= None, outline_line_color = None,
           title= title + "\n")

    #Set Dimensions
    p.frame_width = 400
    p.frame_height = 400
    p.plot_width = 500
    p.plot_height = 500
    p.min_border = 50
#     p.match_aspect = True

    # Set Title
    p.title.text_color = "black"
    p.title.text_font = "arial"
    p.title.align = "center"

    # Set Axis Locations & Style
    p.axis.fixed_location = 0
    p.axis.axis_line_color = 'black'
    p.axis.ticker = tickers.BasicTicker(num_minor_ticks = 4)
    p.x_range = ranges.Range1d(start = -0.4, end = 0.4)
    p.y_range = ranges.Range1d(start = -0.4, end = 0.4)

    # Ticks Length
    p.axis.major_tick_in = 6
    p.axis.major_tick_out = 6
    p.axis.minor_tick_in = 3
    p.axis.minor_tick_out = 3

    # Gridlines
    p.grid.grid_line_color = None

    p.line(x = acc_x, y = acc_y,line_width = 1.5, line_color = '#828282')
    p.circle(x=0, y=0, color="navy",line_color = "firebrick",
             line_width=2, line_dash = 'dashed', fill_color = None,
             radius = 0.2, radius_dimension = 'x', radius_units = 'data')

    return p

p = single_orb_plot(np.random.uniform(-0.35, 0.35, size = 1000),
                    np.random.uniform(-0.35, 0.35, size = 1000),
                    'Title', 0.25)
show(p)