☰Read-only archive⌕
Looking for help with Bokeh?

This is a read-only archive. Ask questions and join the conversation on GitHub.

Visit Community Support on GitHub →
Archived discussions · Captured October 28, 2026

time series visualization graph

Community Support
matdrapeau
matdrapeau

Hello,

There is a kind of graph that is great for large analysis of time series data: horizon charts.

It exists this js library Cubism.js which implement this type of graph.

Wondering if it would be easily possible to integrate with bokeh?

thanks,

Mat

⌁   Link to post
Bryan
Bryan

Mat,

There are currently (as of 0.7) no high level functions for constructing horizon charts, although it has been suggested for possible inclusion in the bokeh.charts interface. I do think a horizon chart would make a great addition to bokeh.charts, but for it to happen in the short term, would probably require a pull request from an interested new contributor. (If you have any interest in working up a bokeh.charts.Horizon PR please let us know!) That said, Bokeh can certainly draw everything needed for a horizon chart, but right now you'd have to compute all the horizons and specify the low level lines, patches, etc, to draw yourself.

Thanks,

Bryan

···

On Jan 2, 2015, at 1:28 PM, matdrapeau@gmail.com wrote:

Hello,

There is a kind of graph that is great for large analysis of time series data: horizon charts.
It exists this js library Cubism.js which implement this type of graph.

Wondering if it would be easily possible to integrate with bokeh?

thanks,
Mat

--
You received this message because you are subscribed to the Google Groups "Bokeh Discussion - Public" group.
To unsubscribe from this group and stop receiving emails from it, send an email to bokeh+unsubscribe@continuum.io.
To post to this group, send email to bokeh@continuum.io.
To view this discussion on the web visit https://groups.google.com/a/continuum.io/d/msgid/bokeh/69b45de1-d24e-4562-9284-324fcb581b79%40continuum.io\.
For more options, visit https://groups.google.com/a/continuum.io/d/optout\.

⌁   Link to post
matdrapeau
matdrapeau

Hello Bryan,
thanks for the response!

There isn’t any ways to hook up an external lib and push data to it in the meantime?

thanks again

···

On Friday, January 2, 2015 2:34:33 PM UTC-5, Bryan Van de ven wrote:

Mat,

There are currently (as of 0.7) no high level functions for constructing horizon charts, although it has been suggested for possible inclusion in the bokeh.charts interface. I do think a horizon chart would make a great addition to bokeh.charts, but for it to happen in the short term, would probably require a pull request from an interested new contributor. (If you have any interest in working up a bokeh.charts.Horizon PR please let us know!) That said, Bokeh can certainly draw everything needed for a horizon chart, but right now you’d have to compute all the horizons and specify the low level lines, patches, etc, to draw yourself.

Thanks,

Bryan

On Jan 2, 2015, at 1:28 PM, matdr...@gmail.com wrote:

Hello,

There is a kind of graph that is great for large analysis of time series data: horizon charts.

It exists this js library https://square.github.io/cubism/ which implement this type of graph.

Wondering if it would be easily possible to integrate with bokeh?

thanks,

Mat

–
You received this message because you are subscribed to the Google Groups “Bokeh Discussion - Public” group.

To unsubscribe from this group and stop receiving emails from it, send an email to bokeh+un...@continuum.io.

To post to this group, send email to bo...@continuum.io.

To view this discussion on the web visit https://groups.google.com/a/continuum.io/d/msgid/bokeh/69b45de1-d24e-4562-9284-324fcb581b79%40continuum.io.

For more options, visit https://groups.google.com/a/continuum.io/d/optout.

⌁   Link to post
Mathieu_Drapeau
Mathieu_Drapeau

Hello Bryan,
I am working on an implementation of the horizon graphs and I am wondering if it is possible to make inverted patch glyphs? Instead of filling under the line, to fill above the line.

thanks,

Mat

···

On Friday, January 2, 2015 at 2:34:33 PM UTC-5, Bryan Van de ven wrote:

Mat,

There are currently (as of 0.7) no high level functions for constructing horizon charts, although it has been suggested for possible inclusion in the bokeh.charts interface. I do think a horizon chart would make a great addition to bokeh.charts, but for it to happen in the short term, would probably require a pull request from an interested new contributor. (If you have any interest in working up a bokeh.charts.Horizon PR please let us know!) That said, Bokeh can certainly draw everything needed for a horizon chart, but right now you’d have to compute all the horizons and specify the low level lines, patches, etc, to draw yourself.

Thanks,

Bryan

On Jan 2, 2015, at 1:28 PM, matdr...@gmail.com wrote:

Hello,

There is a kind of graph that is great for large analysis of time series data: horizon charts.

It exists this js library https://square.github.io/cubism/ which implement this type of graph.

Wondering if it would be easily possible to integrate with bokeh?

thanks,

Mat

–
You received this message because you are subscribed to the Google Groups “Bokeh Discussion - Public” group.

To unsubscribe from this group and stop receiving emails from it, send an email to bokeh+un...@continuum.io.

To post to this group, send email to bo...@continuum.io.

To view this discussion on the web visit https://groups.google.com/a/continuum.io/d/msgid/bokeh/69b45de1-d24e-4562-9284-324fcb581b79%40continuum.io.

For more options, visit https://groups.google.com/a/continuum.io/d/optout.

⌁   Link to post
matdrapeau
matdrapeau

Hello,
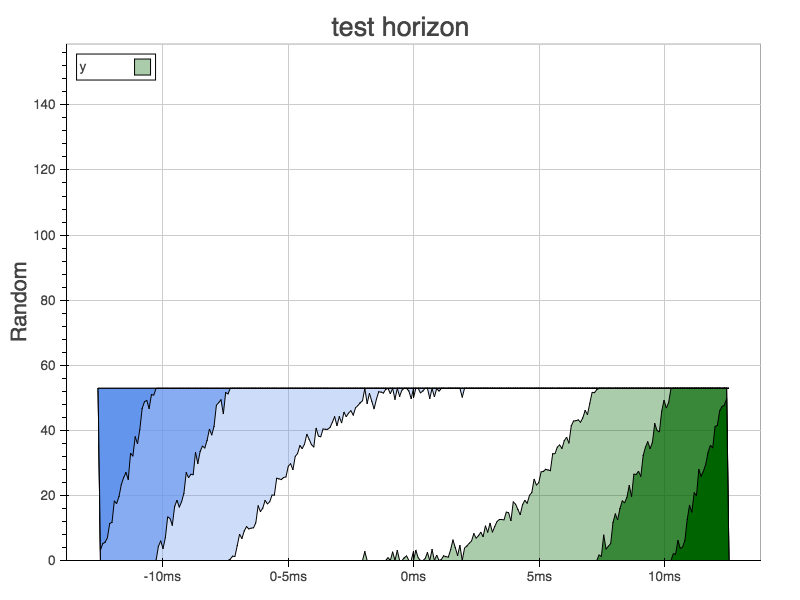
I’ve been working on this horizon graph for some time and here is a little snapshot here of my progress (some credits from this post on stackoverflow: python - Implementing horizon charts in matplotlib - Stack Overflow)

I would need to know if it would be possible to stack different graphs one on top of the others like cubism.js is doing, any clues on how to do it?

I will send a patch once I cleanup a bit the code.

thanks,

Mat

···

On Wednesday, January 14, 2015 at 2:42:21 AM UTC-5, Mathieu Drapeau wrote:

Hello Bryan,
I am working on an implementation of the horizon graphs and I am wondering if it is possible to make inverted patch glyphs? Instead of filling under the line, to fill above the line.

thanks,

Mat

On Friday, January 2, 2015 at 2:34:33 PM UTC-5, Bryan Van de ven wrote:

Mat,

There are currently (as of 0.7) no high level functions for constructing horizon charts, although it has been suggested for possible inclusion in the bokeh.charts interface. I do think a horizon chart would make a great addition to bokeh.charts, but for it to happen in the short term, would probably require a pull request from an interested new contributor. (If you have any interest in working up a bokeh.charts.Horizon PR please let us know!) That said, Bokeh can certainly draw everything needed for a horizon chart, but right now you’d have to compute all the horizons and specify the low level lines, patches, etc, to draw yourself.

Thanks,

Bryan

On Jan 2, 2015, at 1:28 PM, matdr...@gmail.com wrote:

Hello,

There is a kind of graph that is great for large analysis of time series data: horizon charts.

It exists this js library https://square.github.io/cubism/ which implement this type of graph.

Wondering if it would be easily possible to integrate with bokeh?

thanks,

Mat

–
You received this message because you are subscribed to the Google Groups “Bokeh Discussion - Public” group.

To unsubscribe from this group and stop receiving emails from it, send an email to bokeh+un...@continuum.io.

To post to this group, send email to bo...@continuum.io.

To view this discussion on the web visit https://groups.google.com/a/continuum.io/d/msgid/bokeh/69b45de1-d24e-4562-9284-324fcb581b79%40continuum.io.

For more options, visit https://groups.google.com/a/continuum.io/d/optout.

⌁   Link to post
Bryan
Bryan

Hi Mathieu,

There's two ways:

* draw overlapping patches that have alpha < 1 so that the alpha values stack up and the shade of each patch is different.

* draw non-overlapping patches that have their color set explicitly

The latter offers more control but the former may be easier. You can see an example of "stacking areas" by hand here:

  http://bokeh.pydata.org/en/latest/docs/gallery/brewer.html

There is also a bokeh.charts.Area high level schematic interface but it may not (curretntly) offer enough control for you.

Thanks, I lookk forward to seeing the result!

Bryan

···

On Jan 18, 2015, at 12:56 PM, matdrapeau@gmail.com wrote:

Hello,
I've been working on this horizon graph for some time and here is a little snapshot here of my progress (some credits from this post on stackoverflow: python - Implementing horizon charts in matplotlib - Stack Overflow)
I would need to know if it would be possible to stack different graphs one on top of the others like cubism.js is doing, any clues on how to do it?

I will send a patch once I cleanup a bit the code.

thanks,

Mat

On Wednesday, January 14, 2015 at 2:42:21 AM UTC-5, Mathieu Drapeau wrote:
Hello Bryan,
I am working on an implementation of the horizon graphs and I am wondering if it is possible to make inverted patch glyphs? Instead of filling under the line, to fill above the line.

thanks,
Mat

On Friday, January 2, 2015 at 2:34:33 PM UTC-5, Bryan Van de ven wrote:
Mat,

There are currently (as of 0.7) no high level functions for constructing horizon charts, although it has been suggested for possible inclusion in the bokeh.charts interface. I do think a horizon chart would make a great addition to bokeh.charts, but for it to happen in the short term, would probably require a pull request from an interested new contributor. (If you have any interest in working up a bokeh.charts.Horizon PR please let us know!) That said, Bokeh can certainly draw everything needed for a horizon chart, but right now you'd have to compute all the horizons and specify the low level lines, patches, etc, to draw yourself.

Thanks,

Bryan

> On Jan 2, 2015, at 1:28 PM, matdr...@gmail.com wrote:
>
> Hello,
>
> There is a kind of graph that is great for large analysis of time series data: horizon charts.
> It exists this js library Cubism.js which implement this type of graph.
>
> Wondering if it would be easily possible to integrate with bokeh?
>
> thanks,
> Mat
>
> --
> You received this message because you are subscribed to the Google Groups "Bokeh Discussion - Public" group.
> To unsubscribe from this group and stop receiving emails from it, send an email to bokeh+un...@continuum.io.
> To post to this group, send email to bo...@continuum.io.
> To view this discussion on the web visit https://groups.google.com/a/continuum.io/d/msgid/bokeh/69b45de1-d24e-4562-9284-324fcb581b79%40continuum.io\.
> For more options, visit https://groups.google.com/a/continuum.io/d/optout\.

--
You received this message because you are subscribed to the Google Groups "Bokeh Discussion - Public" group.
To unsubscribe from this group and stop receiving emails from it, send an email to bokeh+unsubscribe@continuum.io.
To post to this group, send email to bokeh@continuum.io.
To view this discussion on the web visit https://groups.google.com/a/continuum.io/d/msgid/bokeh/b6b43c21-ee53-46ad-89ca-35569e815745%40continuum.io\.
For more options, visit https://groups.google.com/a/continuum.io/d/optout\.

⌁   Link to post
matdrapeau
matdrapeau

Hello Bryan,
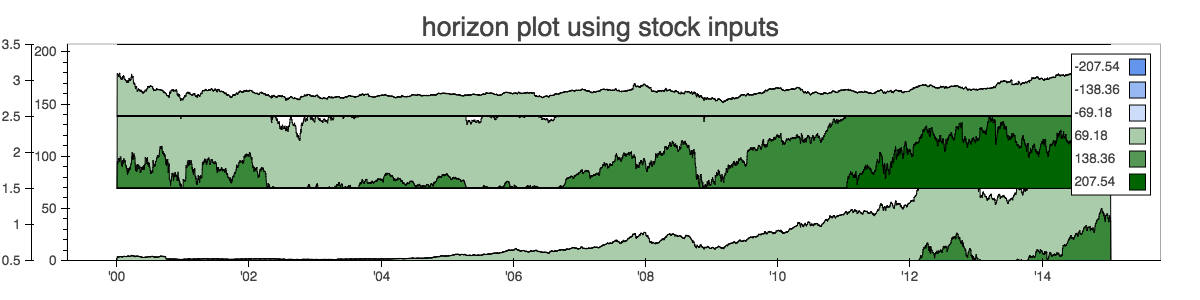
still made some progress… I decided to play with overlapping area and alpha colors finally.

There is one last thing I cannot find how to fix: the y axis.

I need a linear axis even if I smash folds together and number not really match the ticks on the axis. Instead, what I would like to do is display is something similar to a categorical axis that represent the name of each serie of the time series. Is is possible to add another y axis on the plot?

Here is the current output of the chart

thanks,

Mat

···

On Monday, January 19, 2015 at 10:27:21 AM UTC-5, Bryan Van de ven wrote:

Hi Mathieu,

There’s two ways:

  • draw overlapping patches that have alpha < 1 so that the alpha values stack up and the shade of each patch is different.

  • draw non-overlapping patches that have their color set explicitly

The latter offers more control but the former may be easier. You can see an example of “stacking areas” by hand here:

    [http://bokeh.pydata.org/en/latest/docs/gallery/brewer.html](http://bokeh.pydata.org/en/latest/docs/gallery/brewer.html)

There is also a bokeh.charts.Area high level schematic interface but it may not (curretntly) offer enough control for you.

Thanks, I lookk forward to seeing the result!

Bryan

On Jan 18, 2015, at 12:56 PM, matdr...@gmail.com wrote:

Hello,

I’ve been working on this horizon graph for some time and here is a little snapshot here of my progress (some credits from this post on stackoverflow: http://stackoverflow.com/questions/15167928/implementing-horizon-charts-in-matplotlib)

I would need to know if it would be possible to stack different graphs one on top of the others like cubism.js is doing, any clues on how to do it?

I will send a patch once I cleanup a bit the code.

thanks,

Mat

On Wednesday, January 14, 2015 at 2:42:21 AM UTC-5, Mathieu Drapeau wrote:

Hello Bryan,

I am working on an implementation of the horizon graphs and I am wondering if it is possible to make inverted patch glyphs? Instead of filling under the line, to fill above the line.

thanks,

Mat

On Friday, January 2, 2015 at 2:34:33 PM UTC-5, Bryan Van de ven wrote:

Mat,

There are currently (as of 0.7) no high level functions for constructing horizon charts, although it has been suggested for possible inclusion in the bokeh.charts interface. I do think a horizon chart would make a great addition to bokeh.charts, but for it to happen in the short term, would probably require a pull request from an interested new contributor. (If you have any interest in working up a bokeh.charts.Horizon PR please let us know!) That said, Bokeh can certainly draw everything needed for a horizon chart, but right now you’d have to compute all the horizons and specify the low level lines, patches, etc, to draw yourself.

Thanks,

Bryan

On Jan 2, 2015, at 1:28 PM, matdr...@gmail.com wrote:

Hello,

There is a kind of graph that is great for large analysis of time series data: horizon charts.
It exists this js library https://square.github.io/cubism/ which implement this type of graph.

Wondering if it would be easily possible to integrate with bokeh?

thanks,
Mat

–
You received this message because you are subscribed to the Google Groups “Bokeh Discussion - Public” group.
To unsubscribe from this group and stop receiving emails from it, send an email to bokeh+un...@continuum.io.
To post to this group, send email to bo...@continuum.io.
To view this discussion on the web visit https://groups.google.com/a/continuum.io/d/msgid/bokeh/69b45de1-d24e-4562-9284-324fcb581b79%40continuum.io.
For more options, visit https://groups.google.com/a/continuum.io/d/optout.

–
You received this message because you are subscribed to the Google Groups “Bokeh Discussion - Public” group.

To unsubscribe from this group and stop receiving emails from it, send an email to bokeh+un...@continuum.io.

To post to this group, send email to bo...@continuum.io.

To view this discussion on the web visit https://groups.google.com/a/continuum.io/d/msgid/bokeh/b6b43c21-ee53-46ad-89ca-35569e815745%40continuum.io.

For more options, visit https://groups.google.com/a/continuum.io/d/optout.

⌁   Link to post
Bryan
Bryan

Mat,

That looks great! You can add an additional y-axis, you can see an example here:

  https://github.com/bokeh/bokeh/blob/master/examples/plotting/file/twin_axis.py

Basically you configure the plot with an extra (named) range, then then you can add a new axis that refers to that range.

Bryan

···

On Jan 19, 2015, at 9:45 AM, matdrapeau@gmail.com wrote:

Hello Bryan,
still made some progress... I decided to play with overlapping area and alpha colors finally.

There is one last thing I cannot find how to fix: the y axis.
I need a linear axis even if I smash folds together and number not really match the ticks on the axis. Instead, what I would like to do is display is something similar to a categorical axis that represent the name of each serie of the time series. Is is possible to add another y axis on the plot?

Here is the current output of the chart

thanks,
Mat

On Monday, January 19, 2015 at 10:27:21 AM UTC-5, Bryan Van de ven wrote:
Hi Mathieu,

There's two ways:

* draw overlapping patches that have alpha < 1 so that the alpha values stack up and the shade of each patch is different.

* draw non-overlapping patches that have their color set explicitly

The latter offers more control but the former may be easier. You can see an example of "stacking areas" by hand here:

        http://bokeh.pydata.org/en/latest/docs/gallery/brewer.html

There is also a bokeh.charts.Area high level schematic interface but it may not (curretntly) offer enough control for you.

Thanks, I lookk forward to seeing the result!

Bryan

> On Jan 18, 2015, at 12:56 PM, matdr...@gmail.com wrote:
>
> Hello,
> I've been working on this horizon graph for some time and here is a little snapshot here of my progress (some credits from this post on stackoverflow: python - Implementing horizon charts in matplotlib - Stack Overflow)
> I would need to know if it would be possible to stack different graphs one on top of the others like cubism.js is doing, any clues on how to do it?
>
> I will send a patch once I cleanup a bit the code.
>
> thanks,
>
>
> Mat
>
>
> On Wednesday, January 14, 2015 at 2:42:21 AM UTC-5, Mathieu Drapeau wrote:
> Hello Bryan,
> I am working on an implementation of the horizon graphs and I am wondering if it is possible to make inverted patch glyphs? Instead of filling under the line, to fill above the line.
>
> thanks,
> Mat
>
>
>
> On Friday, January 2, 2015 at 2:34:33 PM UTC-5, Bryan Van de ven wrote:
> Mat,
>
> There are currently (as of 0.7) no high level functions for constructing horizon charts, although it has been suggested for possible inclusion in the bokeh.charts interface. I do think a horizon chart would make a great addition to bokeh.charts, but for it to happen in the short term, would probably require a pull request from an interested new contributor. (If you have any interest in working up a bokeh.charts.Horizon PR please let us know!) That said, Bokeh can certainly draw everything needed for a horizon chart, but right now you'd have to compute all the horizons and specify the low level lines, patches, etc, to draw yourself.
>
> Thanks,
>
> Bryan
>
>
> > On Jan 2, 2015, at 1:28 PM, matdr...@gmail.com wrote:
> >
> > Hello,
> >
> > There is a kind of graph that is great for large analysis of time series data: horizon charts.
> > It exists this js library Cubism.js which implement this type of graph.
> >
> > Wondering if it would be easily possible to integrate with bokeh?
> >
> > thanks,
> > Mat
> >
> > --
> > You received this message because you are subscribed to the Google Groups "Bokeh Discussion - Public" group.
> > To unsubscribe from this group and stop receiving emails from it, send an email to bokeh+un...@continuum.io.
> > To post to this group, send email to bo...@continuum.io.
> > To view this discussion on the web visit https://groups.google.com/a/continuum.io/d/msgid/bokeh/69b45de1-d24e-4562-9284-324fcb581b79%40continuum.io\.
> > For more options, visit https://groups.google.com/a/continuum.io/d/optout\.
>
>
> --
> You received this message because you are subscribed to the Google Groups "Bokeh Discussion - Public" group.
> To unsubscribe from this group and stop receiving emails from it, send an email to bokeh+un...@continuum.io.
> To post to this group, send email to bo...@continuum.io.
> To view this discussion on the web visit https://groups.google.com/a/continuum.io/d/msgid/bokeh/b6b43c21-ee53-46ad-89ca-35569e815745%40continuum.io\.
> For more options, visit https://groups.google.com/a/continuum.io/d/optout\.

--
You received this message because you are subscribed to the Google Groups "Bokeh Discussion - Public" group.
To unsubscribe from this group and stop receiving emails from it, send an email to bokeh+unsubscribe@continuum.io.
To post to this group, send email to bokeh@continuum.io.
To view this discussion on the web visit https://groups.google.com/a/continuum.io/d/msgid/bokeh/b6c2dec1-70cf-4172-96c4-01703ff0bd81%40continuum.io\.
For more options, visit https://groups.google.com/a/continuum.io/d/optout\.

⌁   Link to post
matdrapeau
matdrapeau

Bryan, two problems…

  1. I am trying to put on the y axis strings, so I am doing this:

plot.extra_y_ranges = {“series”: FactorRange(factors=self.series)}

but I do get this error:

“expected an element of Dict(String, Instance(Range1d)), got {‘series’: <bokeh.models.ranges.FactorRange object at 0x109e12c90>}”

How it is possible to add another type of axis?

  1. How can I hide the original y axis in order to display only the second one?

thanks,

Mat

···

On Monday, January 19, 2015 at 10:51:03 AM UTC-5, Bryan Van de ven wrote:

Mat,

That looks great! You can add an additional y-axis, you can see an example here:

    [https://github.com/bokeh/bokeh/blob/master/examples/plotting/file/twin_axis.py](https://github.com/bokeh/bokeh/blob/master/examples/plotting/file/twin_axis.py)

Basically you configure the plot with an extra (named) range, then then you can add a new axis that refers to that range.

Bryan

On Jan 19, 2015, at 9:45 AM, matdr...@gmail.com wrote:

Hello Bryan,

still made some progress… I decided to play with overlapping area and alpha colors finally.

There is one last thing I cannot find how to fix: the y axis.

I need a linear axis even if I smash folds together and number not really match the ticks on the axis. Instead, what I would like to do is display is something similar to a categorical axis that represent the name of each serie of the time series. Is is possible to add another y axis on the plot?

Here is the current output of the chart

thanks,

Mat

On Monday, January 19, 2015 at 10:27:21 AM UTC-5, Bryan Van de ven wrote:

Hi Mathieu,

There’s two ways:

  • draw overlapping patches that have alpha < 1 so that the alpha values stack up and the shade of each patch is different.

  • draw non-overlapping patches that have their color set explicitly

The latter offers more control but the former may be easier. You can see an example of “stacking areas” by hand here:

    [http://bokeh.pydata.org/en/latest/docs/gallery/brewer.html](http://bokeh.pydata.org/en/latest/docs/gallery/brewer.html)

There is also a bokeh.charts.Area high level schematic interface but it may not (curretntly) offer enough control for you.

Thanks, I lookk forward to seeing the result!

Bryan

On Jan 18, 2015, at 12:56 PM, matdr...@gmail.com wrote:

Hello,
I’ve been working on this horizon graph for some time and here is a little snapshot here of my progress (some credits from this post on stackoverflow: http://stackoverflow.com/questions/15167928/implementing-horizon-charts-in-matplotlib)
I would need to know if it would be possible to stack different graphs one on top of the others like cubism.js is doing, any clues on how to do it?

I will send a patch once I cleanup a bit the code.

thanks,

Mat

On Wednesday, January 14, 2015 at 2:42:21 AM UTC-5, Mathieu Drapeau wrote:
Hello Bryan,
I am working on an implementation of the horizon graphs and I am wondering if it is possible to make inverted patch glyphs? Instead of filling under the line, to fill above the line.

thanks,
Mat

On Friday, January 2, 2015 at 2:34:33 PM UTC-5, Bryan Van de ven wrote:
Mat,

There are currently (as of 0.7) no high level functions for constructing horizon charts, although it has been suggested for possible inclusion in the bokeh.charts interface. I do think a horizon chart would make a great addition to bokeh.charts, but for it to happen in the short term, would probably require a pull request from an interested new contributor. (If you have any interest in working up a bokeh.charts.Horizon PR please let us know!) That said, Bokeh can certainly draw everything needed for a horizon chart, but right now you’d have to compute all the horizons and specify the low level lines, patches, etc, to draw yourself.

Thanks,

Bryan

On Jan 2, 2015, at 1:28 PM, matdr...@gmail.com wrote:

Hello,

There is a kind of graph that is great for large analysis of time series data: horizon charts.
It exists this js library https://square.github.io/cubism/ which implement this type of graph.

Wondering if it would be easily possible to integrate with bokeh?

thanks,
Mat

–
You received this message because you are subscribed to the Google Groups “Bokeh Discussion - Public” group.
To unsubscribe from this group and stop receiving emails from it, send an email to bokeh+un...@continuum.io.
To post to this group, send email to bo...@continuum.io.
To view this discussion on the web visit https://groups.google.com/a/continuum.io/d/msgid/bokeh/69b45de1-d24e-4562-9284-324fcb581b79%40continuum.io.
For more options, visit https://groups.google.com/a/continuum.io/d/optout.

–
You received this message because you are subscribed to the Google Groups “Bokeh Discussion - Public” group.
To unsubscribe from this group and stop receiving emails from it, send an email to bokeh+un...@continuum.io.
To post to this group, send email to bo...@continuum.io.
To view this discussion on the web visit https://groups.google.com/a/continuum.io/d/msgid/bokeh/b6b43c21-ee53-46ad-89ca-35569e815745%40continuum.io.
For more options, visit https://groups.google.com/a/continuum.io/d/optout.

–
You received this message because you are subscribed to the Google Groups “Bokeh Discussion - Public” group.

To unsubscribe from this group and stop receiving emails from it, send an email to bokeh+un...@continuum.io.

To post to this group, send email to bo...@continuum.io.

To view this discussion on the web visit https://groups.google.com/a/continuum.io/d/msgid/bokeh/b6c2dec1-70cf-4172-96c4-01703ff0bd81%40continuum.io.

For more options, visit https://groups.google.com/a/continuum.io/d/optout.

⌁   Link to post
matdrapeau
matdrapeau

Here is the patch so far:

···

On Monday, January 19, 2015 at 11:47:50 AM UTC-5, matdr...@gmail.com wrote:

Bryan, two problems…

  1. I am trying to put on the y axis strings, so I am doing this:

plot.extra_y_ranges = {“series”: FactorRange(factors=self.series)}

but I do get this error:

“expected an element of Dict(String, Instance(Range1d)), got {‘series’: <bokeh.models.ranges.FactorRange object at 0x109e12c90>}”

How it is possible to add another type of axis?

  1. How can I hide the original y axis in order to display only the second one?

thanks,

Mat

On Monday, January 19, 2015 at 10:51:03 AM UTC-5, Bryan Van de ven wrote:

Mat,

That looks great! You can add an additional y-axis, you can see an example here:

    [https://github.com/bokeh/bokeh/blob/master/examples/plotting/file/twin_axis.py](https://github.com/bokeh/bokeh/blob/master/examples/plotting/file/twin_axis.py)

Basically you configure the plot with an extra (named) range, then then you can add a new axis that refers to that range.

Bryan

On Jan 19, 2015, at 9:45 AM, matdr...@gmail.com wrote:

Hello Bryan,

still made some progress… I decided to play with overlapping area and alpha colors finally.

There is one last thing I cannot find how to fix: the y axis.

I need a linear axis even if I smash folds together and number not really match the ticks on the axis. Instead, what I would like to do is display is something similar to a categorical axis that represent the name of each serie of the time series. Is is possible to add another y axis on the plot?

Here is the current output of the chart

thanks,

Mat

On Monday, January 19, 2015 at 10:27:21 AM UTC-5, Bryan Van de ven wrote:

Hi Mathieu,

There’s two ways:

  • draw overlapping patches that have alpha < 1 so that the alpha values stack up and the shade of each patch is different.

  • draw non-overlapping patches that have their color set explicitly

The latter offers more control but the former may be easier. You can see an example of “stacking areas” by hand here:

    [http://bokeh.pydata.org/en/latest/docs/gallery/brewer.html](http://bokeh.pydata.org/en/latest/docs/gallery/brewer.html)

There is also a bokeh.charts.Area high level schematic interface but it may not (curretntly) offer enough control for you.

Thanks, I lookk forward to seeing the result!

Bryan

On Jan 18, 2015, at 12:56 PM, matdr...@gmail.com wrote:

Hello,
I’ve been working on this horizon graph for some time and here is a little snapshot here of my progress (some credits from this post on stackoverflow: http://stackoverflow.com/questions/15167928/implementing-horizon-charts-in-matplotlib)
I would need to know if it would be possible to stack different graphs one on top of the others like cubism.js is doing, any clues on how to do it?

I will send a patch once I cleanup a bit the code.

thanks,

Mat

On Wednesday, January 14, 2015 at 2:42:21 AM UTC-5, Mathieu Drapeau wrote:
Hello Bryan,
I am working on an implementation of the horizon graphs and I am wondering if it is possible to make inverted patch glyphs? Instead of filling under the line, to fill above the line.

thanks,
Mat

On Friday, January 2, 2015 at 2:34:33 PM UTC-5, Bryan Van de ven wrote:
Mat,

There are currently (as of 0.7) no high level functions for constructing horizon charts, although it has been suggested for possible inclusion in the bokeh.charts interface. I do think a horizon chart would make a great addition to bokeh.charts, but for it to happen in the short term, would probably require a pull request from an interested new contributor. (If you have any interest in working up a bokeh.charts.Horizon PR please let us know!) That said, Bokeh can certainly draw everything needed for a horizon chart, but right now you’d have to compute all the horizons and specify the low level lines, patches, etc, to draw yourself.

Thanks,

Bryan

On Jan 2, 2015, at 1:28 PM, matdr...@gmail.com wrote:

Hello,

There is a kind of graph that is great for large analysis of time series data: horizon charts.
It exists this js library https://square.github.io/cubism/ which implement this type of graph.

Wondering if it would be easily possible to integrate with bokeh?

thanks,
Mat

–
You received this message because you are subscribed to the Google Groups “Bokeh Discussion - Public” group.
To unsubscribe from this group and stop receiving emails from it, send an email to bokeh+un...@continuum.io.
To post to this group, send email to bo...@continuum.io.
To view this discussion on the web visit https://groups.google.com/a/continuum.io/d/msgid/bokeh/69b45de1-d24e-4562-9284-324fcb581b79%40continuum.io.
For more options, visit https://groups.google.com/a/continuum.io/d/optout.

–
You received this message because you are subscribed to the Google Groups “Bokeh Discussion - Public” group.
To unsubscribe from this group and stop receiving emails from it, send an email to bokeh+un...@continuum.io.
To post to this group, send email to bo...@continuum.io.
To view this discussion on the web visit https://groups.google.com/a/continuum.io/d/msgid/bokeh/b6b43c21-ee53-46ad-89ca-35569e815745%40continuum.io.
For more options, visit https://groups.google.com/a/continuum.io/d/optout.

–
You received this message because you are subscribed to the Google Groups “Bokeh Discussion - Public” group.

To unsubscribe from this group and stop receiving emails from it, send an email to bokeh+un...@continuum.io.

To post to this group, send email to bo...@continuum.io.

To view this discussion on the web visit https://groups.google.com/a/continuum.io/d/msgid/bokeh/b6c2dec1-70cf-4172-96c4-01703ff0bd81%40continuum.io.

For more options, visit https://groups.google.com/a/continuum.io/d/optout.

⌁   Link to post
Bryan
Bryan

It just occurs to me that twin axis probably does not yet work with categorical axes, unfortunately. You could try changing the definition of y_extra_ranges to "Dict(String, Instance(Range))" and see if things work out of the box, but I would be surprised. Can you make a GH issue with this information?

Bryan

···

On Jan 19, 2015, at 10:47 AM, matdrapeau@gmail.com wrote:

Bryan, two problems...

1) I am trying to put on the y axis strings, so I am doing this:

    plot.extra_y_ranges = {"series": FactorRange(factors=self.series)}

but I do get this error:

    "expected an element of Dict(String, Instance(Range1d)), got {'series': <bokeh.models.ranges.FactorRange object at 0x109e12c90>}"

How it is possible to add another type of axis?

2) How can I hide the original y axis in order to display only the second one?

thanks,
Mat

On Monday, January 19, 2015 at 10:51:03 AM UTC-5, Bryan Van de ven wrote:
Mat,

That looks great! You can add an additional y-axis, you can see an example here:

        https://github.com/bokeh/bokeh/blob/master/examples/plotting/file/twin_axis.py

Basically you configure the plot with an extra (named) range, then then you can add a new axis that refers to that range.

Bryan

> On Jan 19, 2015, at 9:45 AM, matdr...@gmail.com wrote:
>
> Hello Bryan,
> still made some progress... I decided to play with overlapping area and alpha colors finally.
>
> There is one last thing I cannot find how to fix: the y axis.
> I need a linear axis even if I smash folds together and number not really match the ticks on the axis. Instead, what I would like to do is display is something similar to a categorical axis that represent the name of each serie of the time series. Is is possible to add another y axis on the plot?
>
>
>
> Here is the current output of the chart
>
> thanks,
> Mat
>
>
>
> On Monday, January 19, 2015 at 10:27:21 AM UTC-5, Bryan Van de ven wrote:
> Hi Mathieu,
>
> There's two ways:
>
> * draw overlapping patches that have alpha < 1 so that the alpha values stack up and the shade of each patch is different.
>
> * draw non-overlapping patches that have their color set explicitly
>
> The latter offers more control but the former may be easier. You can see an example of "stacking areas" by hand here:
>
> http://bokeh.pydata.org/en/latest/docs/gallery/brewer.html
>
> There is also a bokeh.charts.Area high level schematic interface but it may not (curretntly) offer enough control for you.
>
> Thanks, I lookk forward to seeing the result!
>
> Bryan
>
>
> > On Jan 18, 2015, at 12:56 PM, matdr...@gmail.com wrote:
> >
> > Hello,
> > I've been working on this horizon graph for some time and here is a little snapshot here of my progress (some credits from this post on stackoverflow: python - Implementing horizon charts in matplotlib - Stack Overflow)
> > I would need to know if it would be possible to stack different graphs one on top of the others like cubism.js is doing, any clues on how to do it?
> >
> > I will send a patch once I cleanup a bit the code.
> >
> > thanks,
> >
> >
> > Mat
> >
> >
> > On Wednesday, January 14, 2015 at 2:42:21 AM UTC-5, Mathieu Drapeau wrote:
> > Hello Bryan,
> > I am working on an implementation of the horizon graphs and I am wondering if it is possible to make inverted patch glyphs? Instead of filling under the line, to fill above the line.
> >
> > thanks,
> > Mat
> >
> >
> >
> > On Friday, January 2, 2015 at 2:34:33 PM UTC-5, Bryan Van de ven wrote:
> > Mat,
> >
> > There are currently (as of 0.7) no high level functions for constructing horizon charts, although it has been suggested for possible inclusion in the bokeh.charts interface. I do think a horizon chart would make a great addition to bokeh.charts, but for it to happen in the short term, would probably require a pull request from an interested new contributor. (If you have any interest in working up a bokeh.charts.Horizon PR please let us know!) That said, Bokeh can certainly draw everything needed for a horizon chart, but right now you'd have to compute all the horizons and specify the low level lines, patches, etc, to draw yourself.
> >
> > Thanks,
> >
> > Bryan
> >
> >
> > > On Jan 2, 2015, at 1:28 PM, matdr...@gmail.com wrote:
> > >
> > > Hello,
> > >
> > > There is a kind of graph that is great for large analysis of time series data: horizon charts.
> > > It exists this js library Cubism.js which implement this type of graph.
> > >
> > > Wondering if it would be easily possible to integrate with bokeh?
> > >
> > > thanks,
> > > Mat
> > >
> > > --
> > > You received this message because you are subscribed to the Google Groups "Bokeh Discussion - Public" group.
> > > To unsubscribe from this group and stop receiving emails from it, send an email to bokeh+un...@continuum.io.
> > > To post to this group, send email to bo...@continuum.io.
> > > To view this discussion on the web visit https://groups.google.com/a/continuum.io/d/msgid/bokeh/69b45de1-d24e-4562-9284-324fcb581b79%40continuum.io\.
> > > For more options, visit https://groups.google.com/a/continuum.io/d/optout\.
> >
> >
> > --
> > You received this message because you are subscribed to the Google Groups "Bokeh Discussion - Public" group.
> > To unsubscribe from this group and stop receiving emails from it, send an email to bokeh+un...@continuum.io.
> > To post to this group, send email to bo...@continuum.io.
> > To view this discussion on the web visit https://groups.google.com/a/continuum.io/d/msgid/bokeh/b6b43c21-ee53-46ad-89ca-35569e815745%40continuum.io\.
> > For more options, visit https://groups.google.com/a/continuum.io/d/optout\.
>
>
> --
> You received this message because you are subscribed to the Google Groups "Bokeh Discussion - Public" group.
> To unsubscribe from this group and stop receiving emails from it, send an email to bokeh+un...@continuum.io.
> To post to this group, send email to bo...@continuum.io.
> To view this discussion on the web visit https://groups.google.com/a/continuum.io/d/msgid/bokeh/b6c2dec1-70cf-4172-96c4-01703ff0bd81%40continuum.io\.
> For more options, visit https://groups.google.com/a/continuum.io/d/optout\.

--
You received this message because you are subscribed to the Google Groups "Bokeh Discussion - Public" group.
To unsubscribe from this group and stop receiving emails from it, send an email to bokeh+unsubscribe@continuum.io.
To post to this group, send email to bokeh@continuum.io.
To view this discussion on the web visit https://groups.google.com/a/continuum.io/d/msgid/bokeh/55f21f34-8251-4957-bb59-b21677b966f0%40continuum.io\.
For more options, visit https://groups.google.com/a/continuum.io/d/optout\.

⌁   Link to post
matdrapeau
matdrapeau

Already tried and here is the result:

It is still a numerical axis that is being rendered…

But in the meantime, is there a way to hide the y axis?

thanks,

Mat

···

On Monday, January 19, 2015 at 5:16:23 PM UTC-5, Bryan Van de ven wrote:

It just occurs to me that twin axis probably does not yet work with categorical axes, unfortunately. You could try changing the definition of y_extra_ranges to “Dict(String, Instance(Range))” and see if things work out of the box, but I would be surprised. Can you make a GH issue with this information?

Bryan

On Jan 19, 2015, at 10:47 AM, matdr...@gmail.com wrote:

Bryan, two problems…

  1. I am trying to put on the y axis strings, so I am doing this:
plot.extra_y_ranges = {"series": FactorRange(factors=self.series)}

but I do get this error:

"expected an element of Dict(String, Instance(Range1d)), got {'series': <bokeh.models.ranges.FactorRange object at 0x109e12c90>}"

How it is possible to add another type of axis?

  1. How can I hide the original y axis in order to display only the second one?

thanks,

Mat

On Monday, January 19, 2015 at 10:51:03 AM UTC-5, Bryan Van de ven wrote:

Mat,

That looks great! You can add an additional y-axis, you can see an example here:

    [https://github.com/bokeh/bokeh/blob/master/examples/plotting/file/twin_axis.py](https://github.com/bokeh/bokeh/blob/master/examples/plotting/file/twin_axis.py)

Basically you configure the plot with an extra (named) range, then then you can add a new axis that refers to that range.

Bryan

On Jan 19, 2015, at 9:45 AM, matdr...@gmail.com wrote:

Hello Bryan,
still made some progress… I decided to play with overlapping area and alpha colors finally.

There is one last thing I cannot find how to fix: the y axis.
I need a linear axis even if I smash folds together and number not really match the ticks on the axis. Instead, what I would like to do is display is something similar to a categorical axis that represent the name of each serie of the time series. Is is possible to add another y axis on the plot?

Here is the current output of the chart

thanks,
Mat

On Monday, January 19, 2015 at 10:27:21 AM UTC-5, Bryan Van de ven wrote:
Hi Mathieu,

There’s two ways:

  • draw overlapping patches that have alpha < 1 so that the alpha values stack up and the shade of each patch is different.

  • draw non-overlapping patches that have their color set explicitly

The latter offers more control but the former may be easier. You can see an example of “stacking areas” by hand here:

    [http://bokeh.pydata.org/en/latest/docs/gallery/brewer.html](http://bokeh.pydata.org/en/latest/docs/gallery/brewer.html)

There is also a bokeh.charts.Area high level schematic interface but it may not (curretntly) offer enough control for you.

Thanks, I lookk forward to seeing the result!

Bryan

On Jan 18, 2015, at 12:56 PM, matdr...@gmail.com wrote:

Hello,
I’ve been working on this horizon graph for some time and here is a little snapshot here of my progress (some credits from this post on stackoverflow: http://stackoverflow.com/questions/15167928/implementing-horizon-charts-in-matplotlib)
I would need to know if it would be possible to stack different graphs one on top of the others like cubism.js is doing, any clues on how to do it?

I will send a patch once I cleanup a bit the code.

thanks,

Mat

On Wednesday, January 14, 2015 at 2:42:21 AM UTC-5, Mathieu Drapeau wrote:
Hello Bryan,
I am working on an implementation of the horizon graphs and I am wondering if it is possible to make inverted patch glyphs? Instead of filling under the line, to fill above the line.

thanks,
Mat

On Friday, January 2, 2015 at 2:34:33 PM UTC-5, Bryan Van de ven wrote:
Mat,

There are currently (as of 0.7) no high level functions for constructing horizon charts, although it has been suggested for possible inclusion in the bokeh.charts interface. I do think a horizon chart would make a great addition to bokeh.charts, but for it to happen in the short term, would probably require a pull request from an interested new contributor. (If you have any interest in working up a bokeh.charts.Horizon PR please let us know!) That said, Bokeh can certainly draw everything needed for a horizon chart, but right now you’d have to compute all the horizons and specify the low level lines, patches, etc, to draw yourself.

Thanks,

Bryan

On Jan 2, 2015, at 1:28 PM, matdr...@gmail.com wrote:

Hello,

There is a kind of graph that is great for large analysis of time series data: horizon charts.
It exists this js library https://square.github.io/cubism/ which implement this type of graph.

Wondering if it would be easily possible to integrate with bokeh?

thanks,
Mat

–
You received this message because you are subscribed to the Google Groups “Bokeh Discussion - Public” group.
To unsubscribe from this group and stop receiving emails from it, send an email to bokeh+un...@continuum.io.
To post to this group, send email to bo...@continuum.io.
To view this discussion on the web visit https://groups.google.com/a/continuum.io/d/msgid/bokeh/69b45de1-d24e-4562-9284-324fcb581b79%40continuum.io.
For more options, visit https://groups.google.com/a/continuum.io/d/optout.

–
You received this message because you are subscribed to the Google Groups “Bokeh Discussion - Public” group.
To unsubscribe from this group and stop receiving emails from it, send an email to bokeh+un...@continuum.io.
To post to this group, send email to bo...@continuum.io.
To view this discussion on the web visit https://groups.google.com/a/continuum.io/d/msgid/bokeh/b6b43c21-ee53-46ad-89ca-35569e815745%40continuum.io.
For more options, visit https://groups.google.com/a/continuum.io/d/optout.

–
You received this message because you are subscribed to the Google Groups “Bokeh Discussion - Public” group.
To unsubscribe from this group and stop receiving emails from it, send an email to bokeh+un...@continuum.io.
To post to this group, send email to bo...@continuum.io.
To view this discussion on the web visit https://groups.google.com/a/continuum.io/d/msgid/bokeh/b6c2dec1-70cf-4172-96c4-01703ff0bd81%40continuum.io.
For more options, visit https://groups.google.com/a/continuum.io/d/optout.

–
You received this message because you are subscribed to the Google Groups “Bokeh Discussion - Public” group.

To unsubscribe from this group and stop receiving emails from it, send an email to bokeh+un...@continuum.io.

To post to this group, send email to bo...@continuum.io.

To view this discussion on the web visit https://groups.google.com/a/continuum.io/d/msgid/bokeh/55f21f34-8251-4957-bb59-b21677b966f0%40continuum.io.

For more options, visit https://groups.google.com/a/continuum.io/d/optout.

⌁   Link to post
matdrapeau
matdrapeau
···

On Monday, January 19, 2015 at 5:33:06 PM UTC-5, matdr...@gmail.com wrote:

Already tried and here is the result:

It is still a numerical axis that is being rendered…

But in the meantime, is there a way to hide the y axis?

thanks,

Mat

On Monday, January 19, 2015 at 5:16:23 PM UTC-5, Bryan Van de ven wrote:

It just occurs to me that twin axis probably does not yet work with categorical axes, unfortunately. You could try changing the definition of y_extra_ranges to “Dict(String, Instance(Range))” and see if things work out of the box, but I would be surprised. Can you make a GH issue with this information?

Bryan

On Jan 19, 2015, at 10:47 AM, matdr...@gmail.com wrote:

Bryan, two problems…

  1. I am trying to put on the y axis strings, so I am doing this:
plot.extra_y_ranges = {"series": FactorRange(factors=self.series)}

but I do get this error:

"expected an element of Dict(String, Instance(Range1d)), got {'series': <bokeh.models.ranges.FactorRange object at 0x109e12c90>}"

How it is possible to add another type of axis?

  1. How can I hide the original y axis in order to display only the second one?

thanks,

Mat

On Monday, January 19, 2015 at 10:51:03 AM UTC-5, Bryan Van de ven wrote:

Mat,

That looks great! You can add an additional y-axis, you can see an example here:

    [https://github.com/bokeh/bokeh/blob/master/examples/plotting/file/twin_axis.py](https://github.com/bokeh/bokeh/blob/master/examples/plotting/file/twin_axis.py)

Basically you configure the plot with an extra (named) range, then then you can add a new axis that refers to that range.

Bryan

On Jan 19, 2015, at 9:45 AM, matdr...@gmail.com wrote:

Hello Bryan,
still made some progress… I decided to play with overlapping area and alpha colors finally.

There is one last thing I cannot find how to fix: the y axis.
I need a linear axis even if I smash folds together and number not really match the ticks on the axis. Instead, what I would like to do is display is something similar to a categorical axis that represent the name of each serie of the time series. Is is possible to add another y axis on the plot?

Here is the current output of the chart

thanks,
Mat

On Monday, January 19, 2015 at 10:27:21 AM UTC-5, Bryan Van de ven wrote:
Hi Mathieu,

There’s two ways:

  • draw overlapping patches that have alpha < 1 so that the alpha values stack up and the shade of each patch is different.

  • draw non-overlapping patches that have their color set explicitly

The latter offers more control but the former may be easier. You can see an example of “stacking areas” by hand here:

    [http://bokeh.pydata.org/en/latest/docs/gallery/brewer.html](http://bokeh.pydata.org/en/latest/docs/gallery/brewer.html)

There is also a bokeh.charts.Area high level schematic interface but it may not (curretntly) offer enough control for you.

Thanks, I lookk forward to seeing the result!

Bryan

On Jan 18, 2015, at 12:56 PM, matdr...@gmail.com wrote:

Hello,
I’ve been working on this horizon graph for some time and here is a little snapshot here of my progress (some credits from this post on stackoverflow: http://stackoverflow.com/questions/15167928/implementing-horizon-charts-in-matplotlib)
I would need to know if it would be possible to stack different graphs one on top of the others like cubism.js is doing, any clues on how to do it?

I will send a patch once I cleanup a bit the code.

thanks,

Mat

On Wednesday, January 14, 2015 at 2:42:21 AM UTC-5, Mathieu Drapeau wrote:
Hello Bryan,
I am working on an implementation of the horizon graphs and I am wondering if it is possible to make inverted patch glyphs? Instead of filling under the line, to fill above the line.

thanks,
Mat

On Friday, January 2, 2015 at 2:34:33 PM UTC-5, Bryan Van de ven wrote:
Mat,

There are currently (as of 0.7) no high level functions for constructing horizon charts, although it has been suggested for possible inclusion in the bokeh.charts interface. I do think a horizon chart would make a great addition to bokeh.charts, but for it to happen in the short term, would probably require a pull request from an interested new contributor. (If you have any interest in working up a bokeh.charts.Horizon PR please let us know!) That said, Bokeh can certainly draw everything needed for a horizon chart, but right now you’d have to compute all the horizons and specify the low level lines, patches, etc, to draw yourself.

Thanks,

Bryan

On Jan 2, 2015, at 1:28 PM, matdr...@gmail.com wrote:

Hello,

There is a kind of graph that is great for large analysis of time series data: horizon charts.
It exists this js library https://square.github.io/cubism/ which implement this type of graph.

Wondering if it would be easily possible to integrate with bokeh?

thanks,
Mat

–
You received this message because you are subscribed to the Google Groups “Bokeh Discussion - Public” group.
To unsubscribe from this group and stop receiving emails from it, send an email to bokeh+un...@continuum.io.
To post to this group, send email to bo...@continuum.io.
To view this discussion on the web visit https://groups.google.com/a/continuum.io/d/msgid/bokeh/69b45de1-d24e-4562-9284-324fcb581b79%40continuum.io.
For more options, visit https://groups.google.com/a/continuum.io/d/optout.

–
You received this message because you are subscribed to the Google Groups “Bokeh Discussion - Public” group.
To unsubscribe from this group and stop receiving emails from it, send an email to bokeh+un...@continuum.io.
To post to this group, send email to bo...@continuum.io.
To view this discussion on the web visit https://groups.google.com/a/continuum.io/d/msgid/bokeh/b6b43c21-ee53-46ad-89ca-35569e815745%40continuum.io.
For more options, visit https://groups.google.com/a/continuum.io/d/optout.

–
You received this message because you are subscribed to the Google Groups “Bokeh Discussion - Public” group.
To unsubscribe from this group and stop receiving emails from it, send an email to bokeh+un...@continuum.io.
To post to this group, send email to bo...@continuum.io.
To view this discussion on the web visit https://groups.google.com/a/continuum.io/d/msgid/bokeh/b6c2dec1-70cf-4172-96c4-01703ff0bd81%40continuum.io.
For more options, visit https://groups.google.com/a/continuum.io/d/optout.

–
You received this message because you are subscribed to the Google Groups “Bokeh Discussion - Public” group.

To unsubscribe from this group and stop receiving emails from it, send an email to bokeh+un...@continuum.io.

To post to this group, send email to bo...@continuum.io.

To view this discussion on the web visit https://groups.google.com/a/continuum.io/d/msgid/bokeh/55f21f34-8251-4957-bb59-b21677b966f0%40continuum.io.

For more options, visit https://groups.google.com/a/continuum.io/d/optout.

⌁   Link to post
Bryan
Bryan

Mat,

That is interesting. Categorical axes are implemented using a synthetic "number" axis as an internal detail and it looks like that is what is getting rendered. Did you add a LinearAxis to the layout? Try adding a CategoricalAxis instead.

There is not a good way to hide an entire axis, that would probably a make a nice feature. In the mean time you can set all the colors for the ticks, labels, etc. to None.

Bryan

···

On Jan 19, 2015, at 4:40 PM, matdrapeau@gmail.com wrote:

Add categorical y axis · Issue #1727 · bokeh/bokeh · GitHub

On Monday, January 19, 2015 at 5:33:06 PM UTC-5, matdr...@gmail.com wrote:
Already tried and here is the result:

It is still a numerical axis that is being rendered...

But in the meantime, is there a way to hide the y axis?

thanks,
Mat

On Monday, January 19, 2015 at 5:16:23 PM UTC-5, Bryan Van de ven wrote:
It just occurs to me that twin axis probably does not yet work with categorical axes, unfortunately. You could try changing the definition of y_extra_ranges to "Dict(String, Instance(Range))" and see if things work out of the box, but I would be surprised. Can you make a GH issue with this information?

Bryan

> On Jan 19, 2015, at 10:47 AM, matdr...@gmail.com wrote:
>
> Bryan, two problems...
>
> 1) I am trying to put on the y axis strings, so I am doing this:
>
> plot.extra_y_ranges = {"series": FactorRange(factors=self.series)}
>
> but I do get this error:
>
> "expected an element of Dict(String, Instance(Range1d)), got {'series': <bokeh.models.ranges.FactorRange object at 0x109e12c90>}"
>
> How it is possible to add another type of axis?
>
>
> 2) How can I hide the original y axis in order to display only the second one?
>
>
> thanks,
> Mat
>
>
>
> On Monday, January 19, 2015 at 10:51:03 AM UTC-5, Bryan Van de ven wrote:
> Mat,
>
> That looks great! You can add an additional y-axis, you can see an example here:
>
> https://github.com/bokeh/bokeh/blob/master/examples/plotting/file/twin_axis.py
>
> Basically you configure the plot with an extra (named) range, then then you can add a new axis that refers to that range.
>
> Bryan
>
> > On Jan 19, 2015, at 9:45 AM, matdr...@gmail.com wrote:
> >
> > Hello Bryan,
> > still made some progress... I decided to play with overlapping area and alpha colors finally.
> >
> > There is one last thing I cannot find how to fix: the y axis.
> > I need a linear axis even if I smash folds together and number not really match the ticks on the axis. Instead, what I would like to do is display is something similar to a categorical axis that represent the name of each serie of the time series. Is is possible to add another y axis on the plot?
> >
> >
> >
> > Here is the current output of the chart
> >
> > thanks,
> > Mat
> >
> >
> >
> > On Monday, January 19, 2015 at 10:27:21 AM UTC-5, Bryan Van de ven wrote:
> > Hi Mathieu,
> >
> > There's two ways:
> >
> > * draw overlapping patches that have alpha < 1 so that the alpha values stack up and the shade of each patch is different.
> >
> > * draw non-overlapping patches that have their color set explicitly
> >
> > The latter offers more control but the former may be easier. You can see an example of "stacking areas" by hand here:
> >
> > http://bokeh.pydata.org/en/latest/docs/gallery/brewer.html
> >
> > There is also a bokeh.charts.Area high level schematic interface but it may not (curretntly) offer enough control for you.
> >
> > Thanks, I lookk forward to seeing the result!
> >
> > Bryan
> >
> >
> > > On Jan 18, 2015, at 12:56 PM, matdr...@gmail.com wrote:
> > >
> > > Hello,
> > > I've been working on this horizon graph for some time and here is a little snapshot here of my progress (some credits from this post on stackoverflow: python - Implementing horizon charts in matplotlib - Stack Overflow)
> > > I would need to know if it would be possible to stack different graphs one on top of the others like cubism.js is doing, any clues on how to do it?
> > >
> > > I will send a patch once I cleanup a bit the code.
> > >
> > > thanks,
> > >
> > >
> > > Mat
> > >
> > >
> > > On Wednesday, January 14, 2015 at 2:42:21 AM UTC-5, Mathieu Drapeau wrote:
> > > Hello Bryan,
> > > I am working on an implementation of the horizon graphs and I am wondering if it is possible to make inverted patch glyphs? Instead of filling under the line, to fill above the line.
> > >
> > > thanks,
> > > Mat
> > >
> > >
> > >
> > > On Friday, January 2, 2015 at 2:34:33 PM UTC-5, Bryan Van de ven wrote:
> > > Mat,
> > >
> > > There are currently (as of 0.7) no high level functions for constructing horizon charts, although it has been suggested for possible inclusion in the bokeh.charts interface. I do think a horizon chart would make a great addition to bokeh.charts, but for it to happen in the short term, would probably require a pull request from an interested new contributor. (If you have any interest in working up a bokeh.charts.Horizon PR please let us know!) That said, Bokeh can certainly draw everything needed for a horizon chart, but right now you'd have to compute all the horizons and specify the low level lines, patches, etc, to draw yourself.
> > >
> > > Thanks,
> > >
> > > Bryan
> > >
> > >
> > > > On Jan 2, 2015, at 1:28 PM, matdr...@gmail.com wrote:
> > > >
> > > > Hello,
> > > >
> > > > There is a kind of graph that is great for large analysis of time series data: horizon charts.
> > > > It exists this js library Cubism.js which implement this type of graph.
> > > >
> > > > Wondering if it would be easily possible to integrate with bokeh?
> > > >
> > > > thanks,
> > > > Mat
> > > >
> > > > --
> > > > You received this message because you are subscribed to the Google Groups "Bokeh Discussion - Public" group.
> > > > To unsubscribe from this group and stop receiving emails from it, send an email to bokeh+un...@continuum.io.
> > > > To post to this group, send email to bo...@continuum.io.
> > > > To view this discussion on the web visit https://groups.google.com/a/continuum.io/d/msgid/bokeh/69b45de1-d24e-4562-9284-324fcb581b79%40continuum.io\.
> > > > For more options, visit https://groups.google.com/a/continuum.io/d/optout\.
> > >
> > >
> > > --
> > > You received this message because you are subscribed to the Google Groups "Bokeh Discussion - Public" group.
> > > To unsubscribe from this group and stop receiving emails from it, send an email to bokeh+un...@continuum.io.
> > > To post to this group, send email to bo...@continuum.io.
> > > To view this discussion on the web visit https://groups.google.com/a/continuum.io/d/msgid/bokeh/b6b43c21-ee53-46ad-89ca-35569e815745%40continuum.io\.
> > > For more options, visit https://groups.google.com/a/continuum.io/d/optout\.
> >
> >
> > --
> > You received this message because you are subscribed to the Google Groups "Bokeh Discussion - Public" group.
> > To unsubscribe from this group and stop receiving emails from it, send an email to bokeh+un...@continuum.io.
> > To post to this group, send email to bo...@continuum.io.
> > To view this discussion on the web visit https://groups.google.com/a/continuum.io/d/msgid/bokeh/b6c2dec1-70cf-4172-96c4-01703ff0bd81%40continuum.io\.
> > For more options, visit https://groups.google.com/a/continuum.io/d/optout\.
>
>
> --
> You received this message because you are subscribed to the Google Groups "Bokeh Discussion - Public" group.
> To unsubscribe from this group and stop receiving emails from it, send an email to bokeh+un...@continuum.io.
> To post to this group, send email to bo...@continuum.io.
> To view this discussion on the web visit https://groups.google.com/a/continuum.io/d/msgid/bokeh/55f21f34-8251-4957-bb59-b21677b966f0%40continuum.io\.
> For more options, visit https://groups.google.com/a/continuum.io/d/optout\.

--
You received this message because you are subscribed to the Google Groups "Bokeh Discussion - Public" group.
To unsubscribe from this group and stop receiving emails from it, send an email to bokeh+unsubscribe@continuum.io.
To post to this group, send email to bokeh@continuum.io.
To view this discussion on the web visit https://groups.google.com/a/continuum.io/d/msgid/bokeh/fe46d1fd-1bdd-4d52-aee0-d788c2283430%40continuum.io\.
For more options, visit https://groups.google.com/a/continuum.io/d/optout\.

⌁   Link to post

End of archived discussion · Replies are disabled