Hi Advanced Bokeh Users
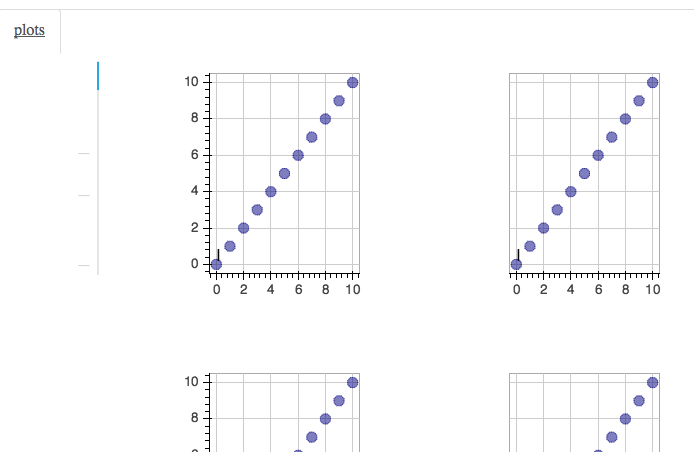
In the Gridplot the toolbar is only partialy visible. The Toolbar works, but is hardly visible (see picture).
CODE:
from bokeh.models.widgets import Panel, Tabs
from bokeh.io import output_file, show,gridplot
from bokeh.plotting import figure,curdoc
output_file(“slider.html”)
leads=[‘I’,‘II’,‘III’,‘AVR’,‘AVL’,‘AVF’,‘V1’,‘V2’,‘V3’,‘V4’,‘V5’]
full_list=[None]*len(leads)
average_list=[None]*len(leads)
x = list(range(11))
y0 = x
y1 = [10-i for i in x]
y2 = [abs(i-5) for i in x]
for i in xrange(len(leads)):
full_list[i]= figure(plot_width=300, plot_height=300)
full_list[i].circle(x, y0, size=10, color=“navy”, alpha=0.5)
full_list[i].text(0, 0, text=[leads[i]])
curdoc().remove_root(full_list[i])
if(i!=0):
full_list[i].x_range=full_list[0].x_range
average_list[i]= figure(plot_width=300, plot_height=300)
average_list[i].circle(x, y0, size=10, color=“navy”, alpha=0.5)
average_list[i].yaxis.visible = None
average_list[i].text(0, 0, text=[leads[i]])
curdoc().remove_root(average_list[i])
for p in full_list+average_list:
p.min_border_left = 100
layout=
for i in xrange(len(leads)):
layout.append([full_list[i],average_list[i]])
#put all the plots in a grid layout
gridlay = gridplot(layout)
tab2 = Panel(child=gridlay, title=“plots”)
tabs = Tabs(tabs=[ tab2 ])
show(tabs)
Thank you very much for your help
Ivo