
☰Read-only archive⌕
Looking for help with Bokeh?

This is a read-only archive. Ask questions and join the conversation on GitHub.

Visit Community Support on GitHub →
Archived discussions · Captured October 28, 2026

Toolbar in gridplot only partialy visible

Community Support
Ivo
Ivo

Hi Advanced Bokeh Users

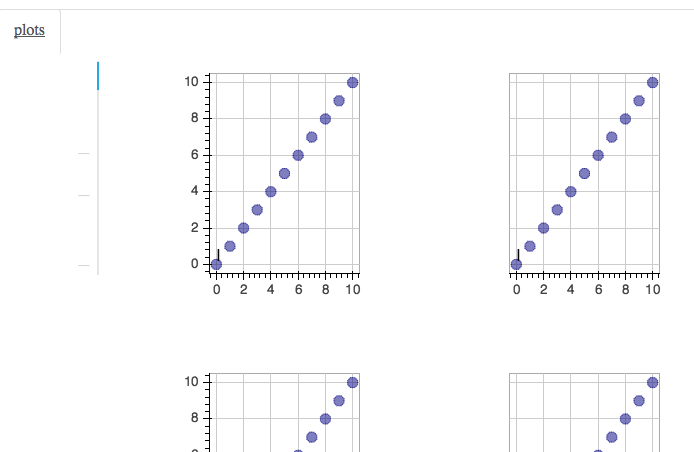
In the Gridplot the toolbar is only partialy visible. The Toolbar works, but is hardly visible (see picture).

CODE:

from bokeh.models.widgets import Panel, Tabs
from bokeh.io import output_file, show,gridplot
from bokeh.plotting import figure,curdoc

output_file(“slider.html”)

leads=[‘I’,‘II’,‘III’,‘AVR’,‘AVL’,‘AVF’,‘V1’,‘V2’,‘V3’,‘V4’,‘V5’]
full_list=[None]*len(leads)
average_list=[None]*len(leads)

x = list(range(11))
y0 = x
y1 = [10-i for i in x]
y2 = [abs(i-5) for i in x]

for i in xrange(len(leads)):
full_list[i]= figure(plot_width=300, plot_height=300)
full_list[i].circle(x, y0, size=10, color=“navy”, alpha=0.5)
full_list[i].text(0, 0, text=[leads[i]])
curdoc().remove_root(full_list[i])
if(i!=0):
full_list[i].x_range=full_list[0].x_range
average_list[i]= figure(plot_width=300, plot_height=300)
average_list[i].circle(x, y0, size=10, color=“navy”, alpha=0.5)
average_list[i].yaxis.visible = None
average_list[i].text(0, 0, text=[leads[i]])
curdoc().remove_root(average_list[i])

for p in full_list+average_list:
p.min_border_left = 100

layout=
for i in xrange(len(leads)):
layout.append([full_list[i],average_list[i]])

#put all the plots in a grid layout
gridlay = gridplot(layout)

tab2 = Panel(child=gridlay, title=“plots”)

tabs = Tabs(tabs=[ tab2 ])

show(tabs)

Thank you very much for your help

Ivo
⌁   Link to post
Bryan
Bryan

Ivo,

I think this is a bug. It is possible the currently ongoing layout work will resolve it naturally, but it would be good to have an issue to track it to make sure it gets resolved at some point. Can you make a GH issue with this information?

  Issues · bokeh/bokeh · GitHub

Thanks,

Bryan

···

On Apr 15, 2016, at 9:33 PM, Ivo <strebelivo@gmail.com> wrote:

Hi Advanced Bokeh Users

In the Gridplot the toolbar is only partialy visible. The Toolbar works, but is hardly visible (see picture).

CODE:

from bokeh.models.widgets import Panel, Tabs
from bokeh.io import output_file, show,gridplot
from bokeh.plotting import figure,curdoc

output_file("slider.html")

leads=['I','II','III','AVR','AVL','AVF','V1','V2','V3','V4','V5']
full_list=[None]*len(leads)
average_list=[None]*len(leads)

x = list(range(11))
y0 = x
y1 = [10-i for i in x]
y2 = [abs(i-5) for i in x]

for i in xrange(len(leads)):
    full_list[i]= figure(plot_width=300, plot_height=300)
    full_list[i].circle(x, y0, size=10, color="navy", alpha=0.5)
    full_list[i].text(0, 0, text=[leads[i]])
    curdoc().remove_root(full_list[i])
    if(i!=0):
        full_list[i].x_range=full_list[0].x_range
    average_list[i]= figure(plot_width=300, plot_height=300)
    average_list[i].circle(x, y0, size=10, color="navy", alpha=0.5)
    average_list[i].yaxis.visible = None
    average_list[i].text(0, 0, text=[leads[i]])
    curdoc().remove_root(average_list[i])

for p in full_list+average_list:
     p.min_border_left = 100

layout=
for i in xrange(len(leads)):
    layout.append([full_list[i],average_list[i]])

#put all the plots in a grid layout
gridlay = gridplot(layout)

tab2 = Panel(child=gridlay, title="plots")

tabs = Tabs(tabs=[ tab2 ])

show(tabs)

Thank you very much for your help

Ivo

--
You received this message because you are subscribed to the Google Groups "Bokeh Discussion - Public" group.
To unsubscribe from this group and stop receiving emails from it, send an email to bokeh+unsubscribe@continuum.io.
To post to this group, send email to bokeh@continuum.io.
To view this discussion on the web visit https://groups.google.com/a/continuum.io/d/msgid/bokeh/5a72feb9-2e20-4b06-bb06-def73aba16e0%40continuum.io\.
For more options, visit https://groups.google.com/a/continuum.io/d/optout\.
<Screen Shot 2016-04-16 at 04.27.59.png>

⌁   Link to post

End of archived discussion · Replies are disabled
