Hi Hank,
We are working on some “computed transforms” features that should make things like this alot simpler, but they are not ready yet. In the mean time the suggestion is to pre-format all the dates (in python) however you would like them to appear, and then add this as a new column, e.g. “formatted_date”, in your column data source.
sourcetds = ColumnDataSource(
data=dict(
year=years,
value=values,
formatted_date= # you format the dates as strings however you like here
)
)
Then your tooltip template should reference this column:
hover = HoverTool(
tooltips="""
<div style="background: #FFFFFF;">
<span style="font-size: 20px;">Year, TDS Value</span><br />
<span style="font-size: 16px; color: black;">(@formatted_date, @value)</span>
</div>
"""
instead of (@year, @value)
Thanks,
Bryan
On Mar 1, 2016, at 4:56 PM, Changheng Yang [email protected] wrote:
Hi Tom,
I tried to follow the post you mentioned. However, I have no idea how to modify my code from the post?
Thanks,
Hank
On Tuesday, March 1, 2016 at 3:51:33 PM UTC-7, Tom Lynch wrote:
The discussion at Date time format in Hovertool might help.
On Tue, Mar 1, 2016 at 4:43 PM, [email protected] wrote:
Hi all,
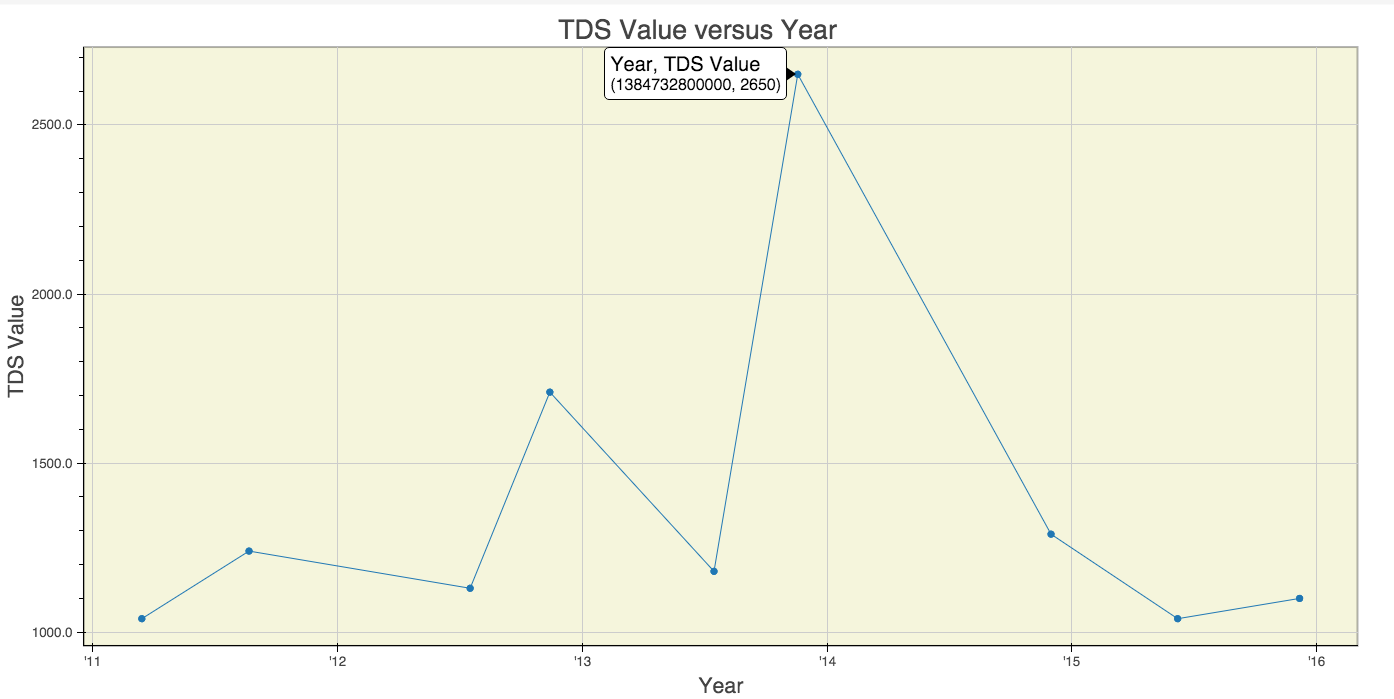
The tool tip does not show the date in the correct format in the line chart.( the image below). However the data was displayed in the correct format in the table below.
My code is listed here. Could anyone share some useful information to convert the integer to the year/month/day in the tooltip. Thanks,
Hank
def makeplotTDS(samplesTDS):
years=[ri["CollectionDate"] for ri in samplesTDS]
    values=[ri["TdsValue"] for ri in samplesTDS]

    sourcetds = ColumnDataSource(
        data=dict(
            year=years,
            value=values,

        )
    )

    hover = HoverTool(
        tooltips="""
             <div style="background: #FFFFFF;">
                <span style="font-size: 20px;">Year, TDS Value</span><br />
                <span style="font-size: 16px; color: black;">(@year, @value)</span>
            </div>
        """
)
–
You received this message because you are subscribed to the Google Groups “Bokeh Discussion - Public” group.
To unsubscribe from this group and stop receiving emails from it, send an email to [email protected].
To post to this group, send email to [email protected].
To view this discussion on the web visit https://groups.google.com/a/continuum.io/d/msgid/bokeh/0e9ffe7a-8a96-47fc-ba07-aaa3855a2826%40continuum.io.
For more options, visit https://groups.google.com/a/continuum.io/d/optout.
–
You received this message because you are subscribed to the Google Groups “Bokeh Discussion - Public” group.
To unsubscribe from this group and stop receiving emails from it, send an email to [email protected].
To post to this group, send email to [email protected].
To view this discussion on the web visit https://groups.google.com/a/continuum.io/d/msgid/bokeh/58a8c81b-b1dd-4316-8c32-995c356d1ff2%40continuum.io.
For more options, visit https://groups.google.com/a/continuum.io/d/optout.
–
You received this message because you are subscribed to the Google Groups “Bokeh Discussion - Public” group.
To unsubscribe from this group and stop receiving emails from it, send an email to [email protected].
To post to this group, send email to [email protected].
To view this discussion on the web visit https://groups.google.com/a/continuum.io/d/msgid/bokeh/42E4FE2D-B5C1-4D08-A4EB-34EB590AE326%40continuum.io.
For more options, visit https://groups.google.com/a/continuum.io/d/optout.