from bokeh.models import HoverTool
from bokeh.plotting import figure, show, output_file
from bokeh.models import Range1d
fill_color = []
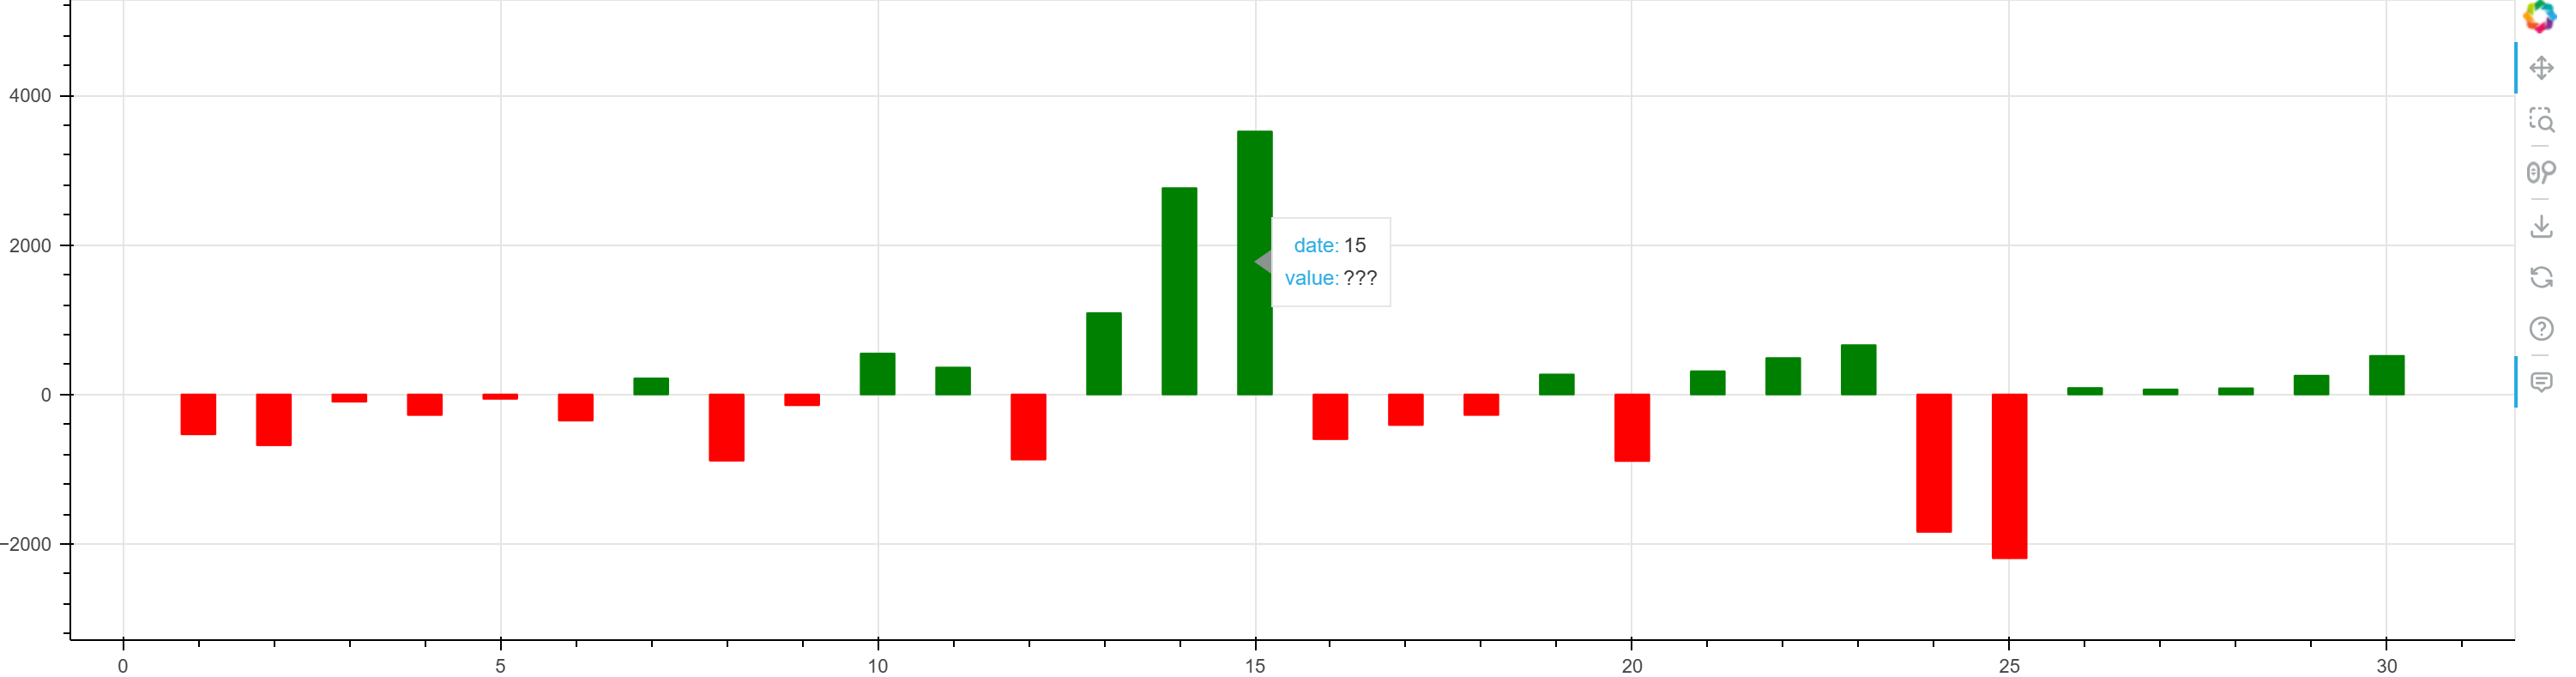
y= [ -533.1,  -679.3,   -96.6,  -274.8,   -58.1,  -349.3,   215,
        -885.7,  -143.7,   547.9,   360.3,  -870.6,  1089,  2760.5,
        3518.1,  -598,  -408.7,  -274.3,   267.5,  -890.1,   310.5,
          487.4,   660, -1838.1, -2190.6,    86.9,    67.2,    82.7,
          251.8,   516.4]
for a in y:
    if a >= 0:
        fill_color.append('green')
    elif a < 0:
        fill_color.append('red')

x=[1, 2, 3, 4, 5, 6, 7, 8, 9, 10, 11, 12, 13, 14, 15, 16, 17, 18, 19, 20, 21, 22, 23, 24, 25, 26, 27, 28, 29, 30]
p = figure(width=1500, height=400)
hover = HoverTool(tooltips=[('date', '@x'), ('value', '@y')])
p.add_tools(hover)
p.vbar(x=x, width=0.45, bottom=0, top=y, color = fill_color)
p.y_range = Range1d(1.5 * min(y), 1.5 * max(y))
show(p)