Ok, I have rewritten the code and fiddled a lot. I tried to have the code run a javascript calculation with js_on_change. See first attempt below. But nothing happened. My sourceSel is not populated (is empty) unless a user selects on the plot or in the table (in the code its updated here: source.selected.js_on_change(‘indices’, CustomJS(args=dict(source=source, sourceSel = sourceSel… ). Is there a way to have sourceSel be populated when the user selects the views?
My last attempt is below too added it as Nth attempt 
I went back to CustomJSTransform since I can at least see something being printed on the console.
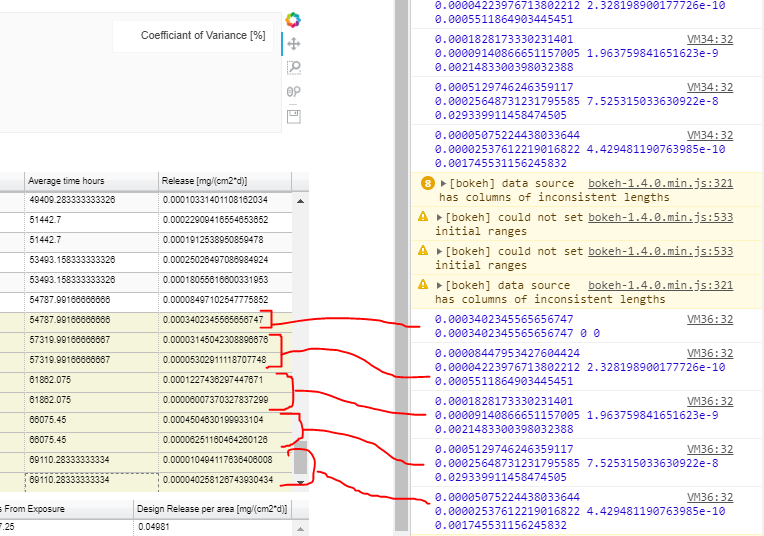
I can see the values are being correctly calculated when the user selects values from the table. See attached image in the next post. Is there a way to just plot the values?
Cant seem to figure it out.
### First attempt ###
sourceSel.js_on_change('data', CustomJS(args=dict(source=sourceSel), code=v_func))
p2.scatter(x='avgtime', y="covar", source=sourceSel, line_width=2,
         color='blue', alpha=0.6,legend_label="Coefficiant of Variance [%] ")
### First attempt  END ###

### Nth attempt  ###

v_func="""

    avgtime = source.data['avgtime']
    rel = source.data['rel']
    source.data['covar'] = [];

    const unique = (value, index, self) => {
    return self.indexOf(value) === index
    }

    function getInd(arr, val) {
    var index = [], i = -1;
    var totalSum = 0;
    var std = 0;

    while ((i = arr.indexOf(val, i+1)) != -1) {
        index.push(i);
        totalSum += rel[i];
        }

    avg = totalSum / index.length;

    while ((i = arr.indexOf(val, i+1)) != -1) {
        index.push(i);
        std += Math.pow((rel[i] - avg), 2)

        }

        covar = std * 100 / avg
        console.log(totalSum, avg, std, covar);
        return covar;
    }
    const uniqueTimes = avgtime.filter(unique)
    covar = uniqueTimes.forEach(timeval => getInd(avgtime, timeval));
"""

CoVar = CustomJSTransform(v_func=v_func, args=dict(source=sourceSel)) #"return xs.map(x => 10 * x);")
p2.scatter(x='avgtime', y=transform('rel', CoVar), source=sourceSel, line_width=2,
         color='blue', alpha=0.6,legend_label="Coefficiant of Variance [%]")