
I tried both, but it’s still a mess.
Works just fine for me with Bokeh 2.2.3:
from datetime import datetime, timedelta
from random import random, uniform

from bokeh.io import show
from bokeh.models import ColumnDataSource
from bokeh.plotting import figure

N = 10
D = datetime.now()
lows = [random() * 10 for _ in range(N)]
highs = [l + random() for l in lows]
ds = ColumnDataSource(dict(date=[D + timedelta(days=i) for i in range(N)],
                           low=lows, high=highs,
                           open=[uniform(l, h) for l, h in zip(lows, highs)],
                           close=[uniform(l, h) for l, h in zip(lows, highs)]))

p = figure()
p.segment('date', 'low', 'date', 'high', source=ds)
p.vbar('date', timedelta(hours=5), 'open', 'close', source=ds)

show(p)
If you can’t figure out what’s wrong with your code/data based on the example above, please provide a minimal reproducible example, including all the imports and the data. And please don’t use images for code - use code blocks in the editor.
try 1 minute
Still works perfectly. If you can update my code above so it doesn’t work as expected, please post the updated version. Otherwise, I cannot help.
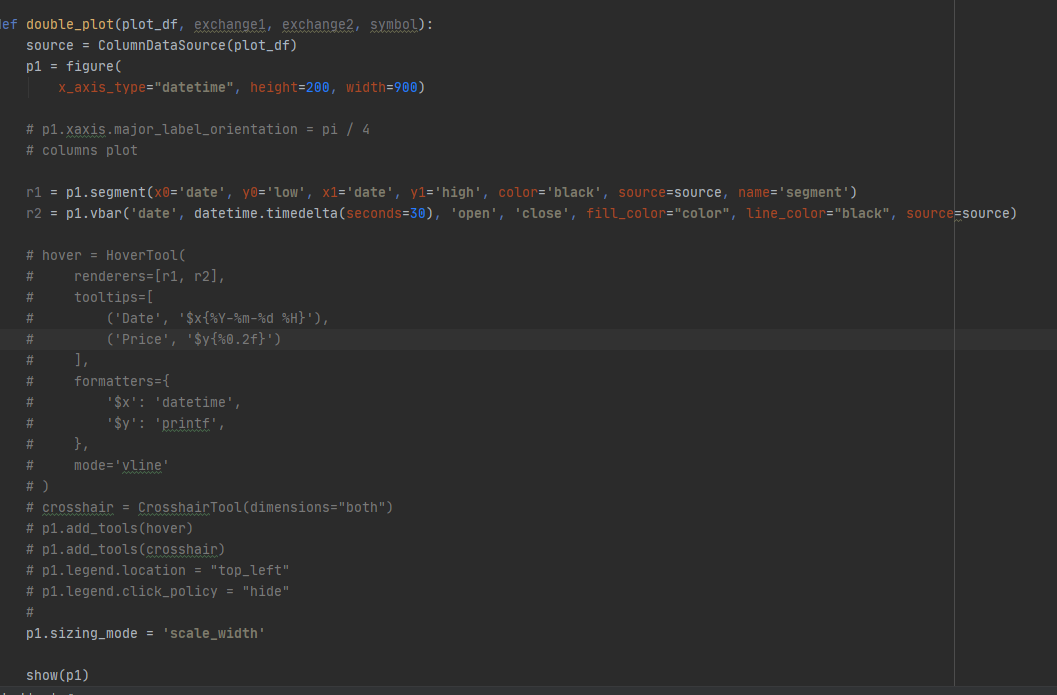
def double_plot(plot_df, exchange1, exchange2, symbol):
source = ColumnDataSource(plot_df)
p1 = figure(
x_axis_type=“datetime”, height=200, width=900)
r1 = p1.segment(x0='date', y0='low', x1='date', y1='high', color='black', source=source, name='segment')
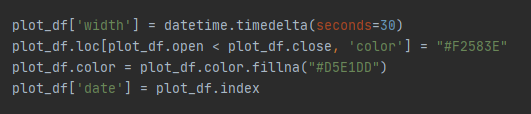
r2 = p1.vbar('date', datetime.timedelta(seconds=30), 'open', 'close', fill_color="color", line_color="black", source=source)
p1.sizing_mode = 'scale_width'
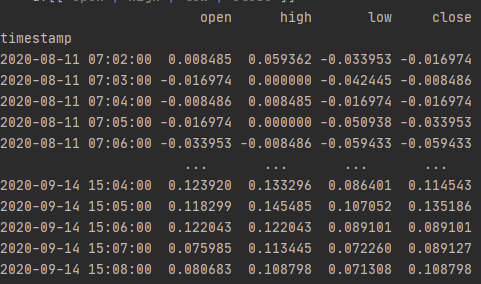
show(p1) open high low close
timestamp
2020-08-11 07:02:00 0.008485 0.059362 -0.033953 -0.016974
2020-08-11 07:03:00 -0.016974 0.000000 -0.042445 -0.008486
2020-08-11 07:04:00 -0.008486 0.008485 -0.016974 -0.016974
2020-08-11 07:05:00 -0.016974 0.000000 -0.050938 -0.033953
2020-08-11 07:06:00 -0.033953 -0.008486 -0.059433 -0.059433
… … … …
2020-09-14 15:04:00 0.123920 0.133296 0.086401 0.114543
2020-09-14 15:05:00 0.118299 0.145485 0.107052 0.135186
2020-09-14 15:06:00 0.122043 0.122043 0.089101 0.089101
2020-09-14 15:07:00 0.075985 0.113445 0.072260 0.089127
2020-09-14 15:08:00 0.080683 0.108798 0.071308 0.108798
This is your code, although I had to spend some of my time on it because you didn’t provide a minimal reproducible example:
import io
from datetime import timedelta

import pandas as pd

from bokeh.io import show
from bokeh.models import ColumnDataSource
from bokeh.plotting import figure

df = pd.read_csv(io.StringIO("""2020-08-11 07:02:00 0.008485 0.059362 -0.033953 -0.016974
2020-08-11 07:03:00 -0.016974 0.000000 -0.042445 -0.008486
2020-08-11 07:04:00 -0.008486 0.008485 -0.016974 -0.016974
2020-08-11 07:05:00 -0.016974 0.000000 -0.050938 -0.033953
2020-08-11 07:06:00 -0.033953 -0.008486 -0.059433 -0.059433
2020-09-14 15:04:00 0.123920 0.133296 0.086401 0.114543
2020-09-14 15:05:00 0.118299 0.145485 0.107052 0.135186
2020-09-14 15:06:00 0.122043 0.122043 0.089101 0.089101
2020-09-14 15:07:00 0.075985 0.113445 0.072260 0.089127
2020-09-14 15:08:00 0.080683 0.108798 0.071308 0.108798"""),
                 names=['date', 'open', 'high', 'low', 'close'],
                 sep=' ')
df['date'] = pd.to_datetime(df['date'])
source = ColumnDataSource(df)

p1 = figure(x_axis_type="datetime", height=200, width=900)

r1 = p1.segment(x0='date', y0='low', x1='date', y1='high', color='black', source=source, name='segment')
r2 = p1.vbar('date', timedelta(seconds=30), 'open', 'close', line_color="black",
             source=source)

p1.sizing_mode = 'scale_width'

show(p1)
It works perfectly with Bokeh 2.2.3.
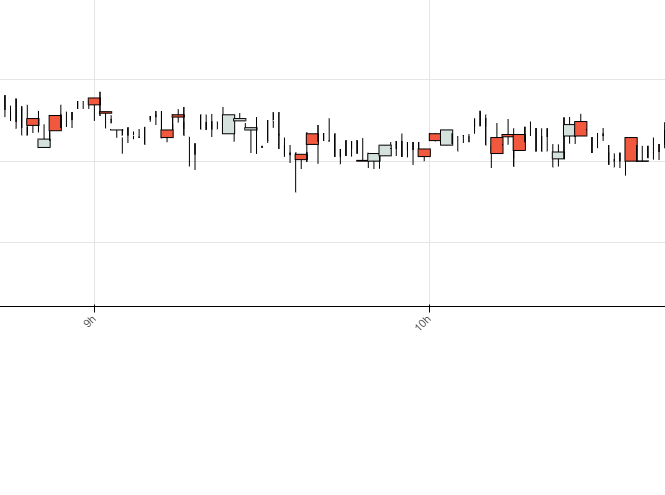
The only issue is that there’s a gap in the data where you have those .... But if you zoom into one of the parts, it should be displayed properly.
Does it work for you? If not, what version of Bokeh are you using?
Ah, I just realized something - maybe your picture is actually absolutely correct. It may look bad because you plot vbar after segment and that may obscure some segments.
What if you plot vbar first and segment last?
version 2.2.2 not working 
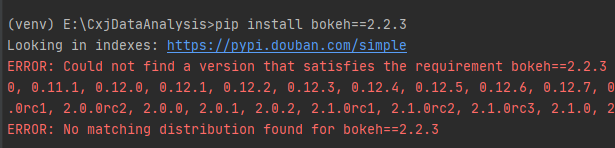
can’t install 2.2.3
I’m downgrading bokeh to v2.1.0, and it work.
And if plot vbar first,there is an ugly black line in the middle of the candle.
Thanks a lot! 
@soysouce There was an error in the publish to pypi yesterday apparently. Version 2.2.3 is available now: bokeh · PyPI
FYI the bug you were seeing is exactly the one that was fixed in this release.