☰Read-only archive⌕
Looking for help with Bokeh?

This is a read-only archive. Ask questions and join the conversation on GitHub.

Visit Community Support on GitHub →
Archived discussions · Captured October 28, 2026

Unable to add an (x,y) point to an existing line plot

Community Support
Josh_Wasserstein
Josh_Wasserstein

Hi,

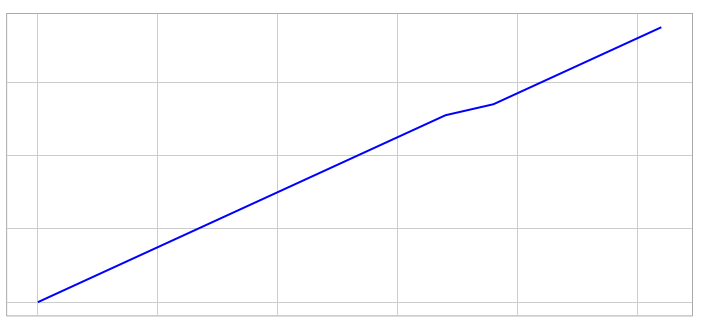
I am trying to add a circle to an existing plot with no luck. In fact, if I try to add a circle I get no axes (see image below). What am I doing wrong?

Here is the relevant part of the code

source = ColumnDataSource(data=dict(

x = ,

y =

))

xdr = DataRange1d(sources=[source.columns(“x”)])

ydr = DataRange1d(sources=[source.columns(“y”)])

plot = Plot(x_range=xdr, y_range=ydr, plot_width=800, plot_height=400)

line_f = Line(x=“x”, y=“y”, line_color=“blue”, line_width=2)

line_f_glyph = Glyph(data_source=source, xdata_range=xdr, ydata_range=ydr, glyph=line_f)

Adding a circle to the plot

circle_f = Circle(x=“x”, y=“y”, line_color=“red”, line_width=2)

circle_f_glyph = Glyph(data_source=ColumnDataSource({‘x’:0, ‘y’:0}), glyph=circle_f)plot.renderers.append(line_f_glyph)

···

#######

plot.renderers.append(line_f_glyph)

plot.renderers.append(circle_f_glyph)

xaxis = LinearAxis(plot=plot)

plot.below.append(xaxis)

yaxis = LinearAxis(plot=plot)

plot.left.append(yaxis)

Josh

⌁   Link to post
Josh_Wasserstein
Josh_Wasserstein

Sorry, I meant to say, that I tried this:

plot = Plot(x_range=xdr, y_range=ydr, plot_width=800, plot_height=400)

line_f = Line(x=“x”, y=“y”, line_color=“blue”, line_width=2)

line_f_glyph = Glyph(data_source=source, xdata_range=xdr, ydata_range=ydr, glyph=line_f)

plot.renderers.append(line_f_glyph)

circle_f = Circle(x=“x”, y=“y”, line_color=“red”, line_width=2)

circle_f_glyph = Glyph(data_source=ColumnDataSource({‘x’:0, ‘y’:0}), glyph=circle_f)

plot.renderers.append(circle_f_glyph)

if I comment out the last three lines, everything works fine (I get axes labels)

Josh

···

On Thu, Aug 28, 2014 at 9:58 AM, Josh Wasserstein ribonucleico@gmail.com wrote:

Hi,

I am trying to add a circle to an existing plot with no luck. In fact, if I try to add a circle I get no axes (see image below). What am I doing wrong?

Here is the relevant part of the code

source = ColumnDataSource(data=dict(

x = ,

y =

))

xdr = DataRange1d(sources=[source.columns(“x”)])

ydr = DataRange1d(sources=[source.columns(“y”)])

plot = Plot(x_range=xdr, y_range=ydr, plot_width=800, plot_height=400)

line_f = Line(x=“x”, y=“y”, line_color=“blue”, line_width=2)

line_f_glyph = Glyph(data_source=source, xdata_range=xdr, ydata_range=ydr, glyph=line_f)

Adding a circle to the plot

circle_f = Circle(x=“x”, y=“y”, line_color=“red”, line_width=2)

circle_f_glyph = Glyph(data_source=ColumnDataSource({‘x’:0, ‘y’:0}), glyph=circle_f)plot.renderers.append(line_f_glyph)

#######

plot.renderers.append(line_f_glyph)

plot.renderers.append(circle_f_glyph)

xaxis = LinearAxis(plot=plot)

plot.below.append(xaxis)

yaxis = LinearAxis(plot=plot)

plot.left.append(yaxis)

Josh

⌁   Link to post
Bryan
Bryan

Josh,

the data needs to be a vector, also the glyph needs the ranges:

from bokeh.objects import *
from bokeh.glyphs import *

source = ColumnDataSource(data=dict(
    x = [-1, 1,2,3],
    y = [-1, 1,2,4]
))

xdr = DataRange1d(sources=[source.columns("x")])
ydr = DataRange1d(sources=[source.columns("y")])

plot = Plot(x_range=xdr, y_range=ydr, plot_width=800, plot_height=400)

line_f = Line(x="x", y="y", line_color="blue", line_width=2)
line_f_glyph = Glyph(data_source=source, xdata_range=xdr, ydata_range=ydr, glyph=line_f)
plot.renderers.append(line_f_glyph)

# Adding a circle to the plot
circle_f = Circle(x="x", y="y", line_color="red", line_width=2, radius=0.2)
circle_f_glyph = Glyph(data_source=ColumnDataSource(data={'x':[0], 'y':[0]}), xdata_range=xdr, ydata_range=ydr, glyph=circle_f)
plot.renderers.append(circle_f_glyph)

···

#######

xaxis = LinearAxis(plot=plot)
plot.below.append(xaxis)
yaxis = LinearAxis(plot=plot)
plot.left.append(yaxis)

Note that a new PR just merged makes the lower level API a little easier to use.

On Aug 28, 2014, at 9:05 AM, Josh Wasserstein <ribonucleico@gmail.com> wrote:

Sorry, I meant to say, that I tried this:

plot = Plot(x_range=xdr, y_range=ydr, plot_width=800, plot_height=400)
line_f = Line(x="x", y="y", line_color="blue", line_width=2)
line_f_glyph = Glyph(data_source=source, xdata_range=xdr, ydata_range=ydr, glyph=line_f)
plot.renderers.append(line_f_glyph)

circle_f = Circle(x="x", y="y", line_color="red", line_width=2)
circle_f_glyph = Glyph(data_source=ColumnDataSource({'x':0, 'y':0}), glyph=circle_f)
plot.renderers.append(circle_f_glyph)

if I comment out the last three lines, everything works fine (I get axes labels)

Josh

On Thu, Aug 28, 2014 at 9:58 AM, Josh Wasserstein <ribonucleico@gmail.com> wrote:
Hi,

I am trying to add a circle to an existing plot with no luck. In fact, if I try to add a circle I get no axes (see image below). What am I doing wrong? <Screen Shot 2014-08-28 at 9.57.35 AM.png>
Here is the relevant part of the code

source = ColumnDataSource(data=dict(
    x = ,
    y =
))

xdr = DataRange1d(sources=[source.columns("x")])
ydr = DataRange1d(sources=[source.columns("y")])

plot = Plot(x_range=xdr, y_range=ydr, plot_width=800, plot_height=400)
line_f = Line(x="x", y="y", line_color="blue", line_width=2)
line_f_glyph = Glyph(data_source=source, xdata_range=xdr, ydata_range=ydr, glyph=line_f)

# Adding a circle to the plot
circle_f = Circle(x="x", y="y", line_color="red", line_width=2)
circle_f_glyph = Glyph(data_source=ColumnDataSource({'x':0, 'y':0}), glyph=circle_f)plot.renderers.append(line_f_glyph)
#######

plot.renderers.append(line_f_glyph)
plot.renderers.append(circle_f_glyph)

xaxis = LinearAxis(plot=plot)
plot.below.append(xaxis)
yaxis = LinearAxis(plot=plot)
plot.left.append(yaxis)

Josh

--
You received this message because you are subscribed to the Google Groups "Bokeh Discussion - Public" group.
To unsubscribe from this group and stop receiving emails from it, send an email to bokeh+unsubscribe@continuum.io.
To post to this group, send email to bokeh@continuum.io.
To view this discussion on the web visit https://groups.google.com/a/continuum.io/d/msgid/bokeh/CAD4ivxWVz_9YmNvtzx66dMMdGyF36a%3DtiqPG3vc_wrFwyTtuNA%40mail.gmail.com\.
For more options, visit https://groups.google.com/a/continuum.io/d/optout\.

⌁   Link to post
Josh_Wasserstein
Josh_Wasserstein

Thanks Bryan. I am using the (latest) build from:
bokeh 0.5.3.dev.20140822 np18py27_1

I guess that PR hasn’t been released into any build yet (?), but it’s good to know.

Josh

···

On Thu, Aug 28, 2014 at 10:13 AM, Bryan Van de Ven bryanv@continuum.io wrote:

Josh,

the data needs to be a vector, also the glyph needs the ranges:

from bokeh.objects import *

from bokeh.glyphs import *

source = ColumnDataSource(data=dict(

x  = [-1, 1,2,3],

y  = [-1, 1,2,4]

))

xdr = DataRange1d(sources=[source.columns(“x”)])

ydr = DataRange1d(sources=[source.columns(“y”)])

plot = Plot(x_range=xdr, y_range=ydr, plot_width=800, plot_height=400)

line_f = Line(x=“x”, y=“y”, line_color=“blue”, line_width=2)

line_f_glyph = Glyph(data_source=source, xdata_range=xdr, ydata_range=ydr, glyph=line_f)

plot.renderers.append(line_f_glyph)

Adding a circle to the plot

circle_f = Circle(x=“x”, y=“y”, line_color=“red”, line_width=2, radius=0.2)

circle_f_glyph = Glyph(data_source=ColumnDataSource(data={‘x’:[0], ‘y’:[0]}), xdata_range=xdr, ydata_range=ydr, glyph=circle_f)

plot.renderers.append(circle_f_glyph)

#######

xaxis = LinearAxis(plot=plot)

plot.below.append(xaxis)

yaxis = LinearAxis(plot=plot)

plot.left.append(yaxis)

Note that a new PR just merged makes the lower level API a little easier to use.

On Aug 28, 2014, at 9:05 AM, Josh Wasserstein ribonucleico@gmail.com wrote:

Sorry, I meant to say, that I tried this:

plot = Plot(x_range=xdr, y_range=ydr, plot_width=800, plot_height=400)

line_f = Line(x=“x”, y=“y”, line_color=“blue”, line_width=2)

line_f_glyph = Glyph(data_source=source, xdata_range=xdr, ydata_range=ydr, glyph=line_f)

plot.renderers.append(line_f_glyph)

circle_f = Circle(x=“x”, y=“y”, line_color=“red”, line_width=2)

circle_f_glyph = Glyph(data_source=ColumnDataSource({‘x’:0, ‘y’:0}), glyph=circle_f)

plot.renderers.append(circle_f_glyph)

if I comment out the last three lines, everything works fine (I get axes labels)

Josh

On Thu, Aug 28, 2014 at 9:58 AM, Josh Wasserstein ribonucleico@gmail.com wrote:

Hi,

I am trying to add a circle to an existing plot with no luck. In fact, if I try to add a circle I get no axes (see image below). What am I doing wrong? <Screen Shot 2014-08-28 at 9.57.35 AM.png>
Here is the relevant part of the code

source = ColumnDataSource(data=dict(

x  = [],
y  = []

))

xdr = DataRange1d(sources=[source.columns(“x”)])

ydr = DataRange1d(sources=[source.columns(“y”)])

plot = Plot(x_range=xdr, y_range=ydr, plot_width=800, plot_height=400)

line_f = Line(x=“x”, y=“y”, line_color=“blue”, line_width=2)

line_f_glyph = Glyph(data_source=source, xdata_range=xdr, ydata_range=ydr, glyph=line_f)

Adding a circle to the plot

circle_f = Circle(x=“x”, y=“y”, line_color=“red”, line_width=2)

circle_f_glyph = Glyph(data_source=ColumnDataSource({‘x’:0, ‘y’:0}), glyph=circle_f)plot.renderers.append(line_f_glyph)

#######

plot.renderers.append(line_f_glyph)

plot.renderers.append(circle_f_glyph)

xaxis = LinearAxis(plot=plot)

plot.below.append(xaxis)

yaxis = LinearAxis(plot=plot)

plot.left.append(yaxis)

Josh

–

You received this message because you are subscribed to the Google Groups “Bokeh Discussion - Public” group.

To unsubscribe from this group and stop receiving emails from it, send an email to bokeh+unsubscribe@continuum.io.

To post to this group, send email to bokeh@continuum.io.

To view this discussion on the web visit https://groups.google.com/a/continuum.io/d/msgid/bokeh/CAD4ivxWVz_9YmNvtzx66dMMdGyF36a%3DtiqPG3vc_wrFwyTtuNA%40mail.gmail.com.

For more options, visit https://groups.google.com/a/continuum.io/d/optout.

–

You received this message because you are subscribed to the Google Groups “Bokeh Discussion - Public” group.

To unsubscribe from this group and stop receiving emails from it, send an email to bokeh+unsubscribe@continuum.io.

To post to this group, send email to bokeh@continuum.io.

To view this discussion on the web visit https://groups.google.com/a/continuum.io/d/msgid/bokeh/9F7A579A-DB62-46F6-A9DF-D6518EB02EA1%40continuum.io.

For more options, visit https://groups.google.com/a/continuum.io/d/optout.

⌁   Link to post
Bryan
Bryan

Right, I just wanted to mention it. :slight_smile: Should be a new dev build soon.

Bryan

···

On Aug 28, 2014, at 9:22 AM, Josh Wasserstein <ribonucleico@gmail.com> wrote:

Thanks Bryan. I am using the (latest) build from:
bokeh 0.5.3.dev.20140822 np18py27_1

I guess that PR hasn't been released into any build yet (?), but it's good to know.

Josh

On Thu, Aug 28, 2014 at 10:13 AM, Bryan Van de Ven <bryan@bokeh.org> wrote:
Josh,

the data needs to be a vector, also the glyph needs the ranges:

from bokeh.objects import *
from bokeh.glyphs import *

source = ColumnDataSource(data=dict(
    x = [-1, 1,2,3],
    y = [-1, 1,2,4]
))

xdr = DataRange1d(sources=[source.columns("x")])
ydr = DataRange1d(sources=[source.columns("y")])

plot = Plot(x_range=xdr, y_range=ydr, plot_width=800, plot_height=400)

line_f = Line(x="x", y="y", line_color="blue", line_width=2)
line_f_glyph = Glyph(data_source=source, xdata_range=xdr, ydata_range=ydr, glyph=line_f)
plot.renderers.append(line_f_glyph)

# Adding a circle to the plot
circle_f = Circle(x="x", y="y", line_color="red", line_width=2, radius=0.2)
circle_f_glyph = Glyph(data_source=ColumnDataSource(data={'x':[0], 'y':[0]}), xdata_range=xdr, ydata_range=ydr, glyph=circle_f)
plot.renderers.append(circle_f_glyph)
#######

xaxis = LinearAxis(plot=plot)
plot.below.append(xaxis)
yaxis = LinearAxis(plot=plot)
plot.left.append(yaxis)

Note that a new PR just merged makes the lower level API a little easier to use.

On Aug 28, 2014, at 9:05 AM, Josh Wasserstein <ribonucleico@gmail.com> wrote:

> Sorry, I meant to say, that I tried this:
>
> plot = Plot(x_range=xdr, y_range=ydr, plot_width=800, plot_height=400)
> line_f = Line(x="x", y="y", line_color="blue", line_width=2)
> line_f_glyph = Glyph(data_source=source, xdata_range=xdr, ydata_range=ydr, glyph=line_f)
> plot.renderers.append(line_f_glyph)
>
> circle_f = Circle(x="x", y="y", line_color="red", line_width=2)
> circle_f_glyph = Glyph(data_source=ColumnDataSource({'x':0, 'y':0}), glyph=circle_f)
> plot.renderers.append(circle_f_glyph)
>
> if I comment out the last three lines, everything works fine (I get axes labels)
>
> Josh
>
>
> On Thu, Aug 28, 2014 at 9:58 AM, Josh Wasserstein <ribonucleico@gmail.com> wrote:
> Hi,
>
> I am trying to add a circle to an existing plot with no luck. In fact, if I try to add a circle I get no axes (see image below). What am I doing wrong? <Screen Shot 2014-08-28 at 9.57.35 AM.png>
> Here is the relevant part of the code
>
> source = ColumnDataSource(data=dict(
> x = ,
> y =
> ))
>
> xdr = DataRange1d(sources=[source.columns("x")])
> ydr = DataRange1d(sources=[source.columns("y")])
>
> plot = Plot(x_range=xdr, y_range=ydr, plot_width=800, plot_height=400)
> line_f = Line(x="x", y="y", line_color="blue", line_width=2)
> line_f_glyph = Glyph(data_source=source, xdata_range=xdr, ydata_range=ydr, glyph=line_f)
>
> # Adding a circle to the plot
> circle_f = Circle(x="x", y="y", line_color="red", line_width=2)
> circle_f_glyph = Glyph(data_source=ColumnDataSource({'x':0, 'y':0}), glyph=circle_f)plot.renderers.append(line_f_glyph)
> #######
>
> plot.renderers.append(line_f_glyph)
> plot.renderers.append(circle_f_glyph)
>
> xaxis = LinearAxis(plot=plot)
> plot.below.append(xaxis)
> yaxis = LinearAxis(plot=plot)
> plot.left.append(yaxis)
>
> Josh
>
>
> --
> You received this message because you are subscribed to the Google Groups "Bokeh Discussion - Public" group.
> To unsubscribe from this group and stop receiving emails from it, send an email to bokeh+unsubscribe@continuum.io.
> To post to this group, send email to bokeh@continuum.io.
> To view this discussion on the web visit https://groups.google.com/a/continuum.io/d/msgid/bokeh/CAD4ivxWVz_9YmNvtzx66dMMdGyF36a%3DtiqPG3vc_wrFwyTtuNA%40mail.gmail.com\.
> For more options, visit https://groups.google.com/a/continuum.io/d/optout\.

--
You received this message because you are subscribed to the Google Groups "Bokeh Discussion - Public" group.
To unsubscribe from this group and stop receiving emails from it, send an email to bokeh+unsubscribe@continuum.io.
To post to this group, send email to bokeh@continuum.io.
To view this discussion on the web visit https://groups.google.com/a/continuum.io/d/msgid/bokeh/9F7A579A-DB62-46F6-A9DF-D6518EB02EA1%40continuum.io\.
For more options, visit https://groups.google.com/a/continuum.io/d/optout\.
--
You received this message because you are subscribed to the Google Groups "Bokeh Discussion - Public" group.
To unsubscribe from this group and stop receiving emails from it, send an email to bokeh+unsubscribe@continuum.io.
To post to this group, send email to bokeh@continuum.io.
To view this discussion on the web visit https://groups.google.com/a/continuum.io/d/msgid/bokeh/CAD4ivxV3Fe%3DADt1YP27kCc%2B_16SC%2BBavOPDbS_vbkEvk%2BhzDCg%40mail.gmail.com\.
For more options, visit https://groups.google.com/a/continuum.io/d/optout\.

⌁   Link to post
Damian_Avila
Damian_Avila

We release builds on Friday, so it will be available by tomorrow afternoon if you are interested.
The merged PR with the new function is this one: https://github.com/ContinuumIO/bokeh/pull/1041

···

On Thu, Aug 28, 2014 at 11:22 AM, Josh Wasserstein ribonucleico@gmail.com wrote:

Thanks Bryan. I am using the (latest) build from:
bokeh 0.5.3.dev.20140822 np18py27_1

I guess that PR hasn’t been released into any build yet (?), but it’s good to know.

Josh

–

You received this message because you are subscribed to the Google Groups “Bokeh Discussion - Public” group.

To unsubscribe from this group and stop receiving emails from it, send an email to bokeh+unsubscribe@continuum.io.

To post to this group, send email to bokeh@continuum.io.

To view this discussion on the web visit https://groups.google.com/a/continuum.io/d/msgid/bokeh/CAD4ivxV3Fe%3DADt1YP27kCc%2B_16SC%2BBavOPDbS_vbkEvk%2BhzDCg%40mail.gmail.com.

For more options, visit https://groups.google.com/a/continuum.io/d/optout.

On Thu, Aug 28, 2014 at 10:13 AM, Bryan Van de Ven bryan@bokeh.org wrote:

Josh,

the data needs to be a vector, also the glyph needs the ranges:

from bokeh.objects import *

from bokeh.glyphs import *

source = ColumnDataSource(data=dict(

x  = [-1, 1,2,3],

y  = [-1, 1,2,4]

))

xdr = DataRange1d(sources=[source.columns(“x”)])

ydr = DataRange1d(sources=[source.columns(“y”)])

plot = Plot(x_range=xdr, y_range=ydr, plot_width=800, plot_height=400)

line_f = Line(x=“x”, y=“y”, line_color=“blue”, line_width=2)

line_f_glyph = Glyph(data_source=source, xdata_range=xdr, ydata_range=ydr, glyph=line_f)

plot.renderers.append(line_f_glyph)

Adding a circle to the plot

circle_f = Circle(x=“x”, y=“y”, line_color=“red”, line_width=2, radius=0.2)

circle_f_glyph = Glyph(data_source=ColumnDataSource(data={‘x’:[0], ‘y’:[0]}), xdata_range=xdr, ydata_range=ydr, glyph=circle_f)

plot.renderers.append(circle_f_glyph)

#######

xaxis = LinearAxis(plot=plot)

plot.below.append(xaxis)

yaxis = LinearAxis(plot=plot)

plot.left.append(yaxis)

Note that a new PR just merged makes the lower level API a little easier to use.

On Aug 28, 2014, at 9:05 AM, Josh Wasserstein ribonucleico@gmail.com wrote:

Sorry, I meant to say, that I tried this:

plot = Plot(x_range=xdr, y_range=ydr, plot_width=800, plot_height=400)

line_f = Line(x=“x”, y=“y”, line_color=“blue”, line_width=2)

line_f_glyph = Glyph(data_source=source, xdata_range=xdr, ydata_range=ydr, glyph=line_f)

plot.renderers.append(line_f_glyph)

circle_f = Circle(x=“x”, y=“y”, line_color=“red”, line_width=2)

circle_f_glyph = Glyph(data_source=ColumnDataSource({‘x’:0, ‘y’:0}), glyph=circle_f)

plot.renderers.append(circle_f_glyph)

if I comment out the last three lines, everything works fine (I get axes labels)

Josh

On Thu, Aug 28, 2014 at 9:58 AM, Josh Wasserstein ribonucleico@gmail.com wrote:

Hi,

I am trying to add a circle to an existing plot with no luck. In fact, if I try to add a circle I get no axes (see image below). What am I doing wrong? <Screen Shot 2014-08-28 at 9.57.35 AM.png>
Here is the relevant part of the code

source = ColumnDataSource(data=dict(

x  = [],
y  = []

))

xdr = DataRange1d(sources=[source.columns(“x”)])

ydr = DataRange1d(sources=[source.columns(“y”)])

plot = Plot(x_range=xdr, y_range=ydr, plot_width=800, plot_height=400)

line_f = Line(x=“x”, y=“y”, line_color=“blue”, line_width=2)

line_f_glyph = Glyph(data_source=source, xdata_range=xdr, ydata_range=ydr, glyph=line_f)

Adding a circle to the plot

circle_f = Circle(x=“x”, y=“y”, line_color=“red”, line_width=2)

circle_f_glyph = Glyph(data_source=ColumnDataSource({‘x’:0, ‘y’:0}), glyph=circle_f)plot.renderers.append(line_f_glyph)

#######

plot.renderers.append(line_f_glyph)

plot.renderers.append(circle_f_glyph)

xaxis = LinearAxis(plot=plot)

plot.below.append(xaxis)

yaxis = LinearAxis(plot=plot)

plot.left.append(yaxis)

Josh

–

You received this message because you are subscribed to the Google Groups “Bokeh Discussion - Public” group.

To unsubscribe from this group and stop receiving emails from it, send an email to bokeh+unsubscribe@continuum.io.

To post to this group, send email to bokeh@continuum.io.

To view this discussion on the web visit https://groups.google.com/a/continuum.io/d/msgid/bokeh/CAD4ivxWVz_9YmNvtzx66dMMdGyF36a%3DtiqPG3vc_wrFwyTtuNA%40mail.gmail.com.

For more options, visit https://groups.google.com/a/continuum.io/d/optout.

–

You received this message because you are subscribed to the Google Groups “Bokeh Discussion - Public” group.

To unsubscribe from this group and stop receiving emails from it, send an email to bokeh+unsubscribe@continuum.io.

To post to this group, send email to bokeh@continuum.io.

To view this discussion on the web visit https://groups.google.com/a/continuum.io/d/msgid/bokeh/9F7A579A-DB62-46F6-A9DF-D6518EB02EA1%40continuum.io.

For more options, visit https://groups.google.com/a/continuum.io/d/optout.

⌁   Link to post
Hugo_Shi
Hugo_Shi

btw what you're trying to do should be doable with the high level API.

from bokeh.plotting import *
output_file("line.html", title="line.py example")
source = ColumnDataSource(data=dict(
     x = [-1, 1,2,3],
     y = [-1, 1,2,4]
))
plot = line(x="x", y="y", line_color="blue", line_width=2, source=source, plot_width=800, plot_height=400)
plot.circle(x="x", y="y", line_color="red", line_width=2, radius=0.2, source=source)
show()

···

On 08/28/2014 10:13 AM, Bryan Van de Ven wrote:

Josh,

the data needs to be a vector, also the glyph needs the ranges:

from bokeh.objects import *
from bokeh.glyphs import *

source = ColumnDataSource(data=dict(
     x = [-1, 1,2,3],
     y = [-1, 1,2,4]
))

xdr = DataRange1d(sources=[source.columns("x")])
ydr = DataRange1d(sources=[source.columns("y")])

plot = Plot(x_range=xdr, y_range=ydr, plot_width=800, plot_height=400)

line_f = Line(x="x", y="y", line_color="blue", line_width=2)
line_f_glyph = Glyph(data_source=source, xdata_range=xdr, ydata_range=ydr, glyph=line_f)
plot.renderers.append(line_f_glyph)

# Adding a circle to the plot
circle_f = Circle(x="x", y="y", line_color="red", line_width=2, radius=0.2)
circle_f_glyph = Glyph(data_source=ColumnDataSource(data={'x':[0], 'y':[0]}), xdata_range=xdr, ydata_range=ydr, glyph=circle_f)
plot.renderers.append(circle_f_glyph)
#######

xaxis = LinearAxis(plot=plot)
plot.below.append(xaxis)
yaxis = LinearAxis(plot=plot)
plot.left.append(yaxis)

Note that a new PR just merged makes the lower level API a little easier to use.

On Aug 28, 2014, at 9:05 AM, Josh Wasserstein <ribonucleico@gmail.com> wrote:

Sorry, I meant to say, that I tried this:

plot = Plot(x_range=xdr, y_range=ydr, plot_width=800, plot_height=400)
line_f = Line(x="x", y="y", line_color="blue", line_width=2)
line_f_glyph = Glyph(data_source=source, xdata_range=xdr, ydata_range=ydr, glyph=line_f)
plot.renderers.append(line_f_glyph)

circle_f = Circle(x="x", y="y", line_color="red", line_width=2)
circle_f_glyph = Glyph(data_source=ColumnDataSource({'x':0, 'y':0}), glyph=circle_f)
plot.renderers.append(circle_f_glyph)

if I comment out the last three lines, everything works fine (I get axes labels)

Josh

On Thu, Aug 28, 2014 at 9:58 AM, Josh Wasserstein <ribonucleico@gmail.com> wrote:
Hi,

I am trying to add a circle to an existing plot with no luck. In fact, if I try to add a circle I get no axes (see image below). What am I doing wrong? <Screen Shot 2014-08-28 at 9.57.35 AM.png>
Here is the relevant part of the code

source = ColumnDataSource(data=dict(
     x = ,
     y =
))

xdr = DataRange1d(sources=[source.columns("x")])
ydr = DataRange1d(sources=[source.columns("y")])

plot = Plot(x_range=xdr, y_range=ydr, plot_width=800, plot_height=400)
line_f = Line(x="x", y="y", line_color="blue", line_width=2)
line_f_glyph = Glyph(data_source=source, xdata_range=xdr, ydata_range=ydr, glyph=line_f)

# Adding a circle to the plot
circle_f = Circle(x="x", y="y", line_color="red", line_width=2)
circle_f_glyph = Glyph(data_source=ColumnDataSource({'x':0, 'y':0}), glyph=circle_f)plot.renderers.append(line_f_glyph)
#######

plot.renderers.append(line_f_glyph)
plot.renderers.append(circle_f_glyph)

xaxis = LinearAxis(plot=plot)
plot.below.append(xaxis)
yaxis = LinearAxis(plot=plot)
plot.left.append(yaxis)

Josh

--
You received this message because you are subscribed to the Google Groups "Bokeh Discussion - Public" group.
To unsubscribe from this group and stop receiving emails from it, send an email to bokeh+unsubscribe@continuum.io.
To post to this group, send email to bokeh@continuum.io.
To view this discussion on the web visit https://groups.google.com/a/continuum.io/d/msgid/bokeh/CAD4ivxWVz_9YmNvtzx66dMMdGyF36a%3DtiqPG3vc_wrFwyTtuNA%40mail.gmail.com\.
For more options, visit https://groups.google.com/a/continuum.io/d/optout\.

⌁   Link to post
Josh_Wasserstein
Josh_Wasserstein

Thanks! That works great. One thing I noticed is that I can’t zoom nor hover over the chart (I built my document from modifications to taylor_server.py, which doesn’t seem to support this either). Do you know why?

Josh

···

On Thu, Aug 28, 2014 at 11:06 AM, Hugo Shi hugo.r.shi@gmail.com wrote:

btw what you’re trying to do should be doable with the high level API.

from bokeh.plotting import *

output_file(“line.html”, title=“line.py example”)

source = ColumnDataSource(data=dict(

x  = [-1, 1,2,3],

y  = [-1, 1,2,4]

))

plot = line(x=“x”, y=“y”, line_color=“blue”, line_width=2, source=source, plot_width=800, plot_height=400)

plot.circle(x=“x”, y=“y”, line_color=“red”, line_width=2, radius=0.2, source=source)

show()

On 08/28/2014 10:13 AM, Bryan Van de Ven wrote:

Josh,

the data needs to be a vector, also the glyph needs the ranges:

from bokeh.objects import *

from bokeh.glyphs import *

source = ColumnDataSource(data=dict(

 x  = [-1, 1,2,3],

 y  = [-1, 1,2,4]

))

xdr = DataRange1d(sources=[source.columns(“x”)])

ydr = DataRange1d(sources=[source.columns(“y”)])

plot = Plot(x_range=xdr, y_range=ydr, plot_width=800, plot_height=400)

line_f = Line(x=“x”, y=“y”, line_color=“blue”, line_width=2)

line_f_glyph = Glyph(data_source=source, xdata_range=xdr, ydata_range=ydr, glyph=line_f)

plot.renderers.append(line_f_glyph)

Adding a circle to the plot

circle_f = Circle(x=“x”, y=“y”, line_color=“red”, line_width=2, radius=0.2)

circle_f_glyph = Glyph(data_source=ColumnDataSource(data={‘x’:[0], ‘y’:[0]}), xdata_range=xdr, ydata_range=ydr, glyph=circle_f)

plot.renderers.append(circle_f_glyph)

#######

xaxis = LinearAxis(plot=plot)

plot.below.append(xaxis)

yaxis = LinearAxis(plot=plot)

plot.left.append(yaxis)

Note that a new PR just merged makes the lower level API a little easier to use.

On Aug 28, 2014, at 9:05 AM, Josh Wasserstein ribonucleico@gmail.com wrote:

Sorry, I meant to say, that I tried this:

plot = Plot(x_range=xdr, y_range=ydr, plot_width=800, plot_height=400)

line_f = Line(x=“x”, y=“y”, line_color=“blue”, line_width=2)

line_f_glyph = Glyph(data_source=source, xdata_range=xdr, ydata_range=ydr, glyph=line_f)

plot.renderers.append(line_f_glyph)

circle_f = Circle(x=“x”, y=“y”, line_color=“red”, line_width=2)

circle_f_glyph = Glyph(data_source=ColumnDataSource({‘x’:0, ‘y’:0}), glyph=circle_f)

plot.renderers.append(circle_f_glyph)

if I comment out the last three lines, everything works fine (I get axes labels)

Josh

On Thu, Aug 28, 2014 at 9:58 AM, Josh Wasserstein ribonucleico@gmail.com wrote:

Hi,

I am trying to add a circle to an existing plot with no luck. In fact, if I try to add a circle I get no axes (see image below). What am I doing wrong? <Screen Shot 2014-08-28 at 9.57.35 AM.png>

Here is the relevant part of the code

source = ColumnDataSource(data=dict(

 x  = [],

 y  = []

))

xdr = DataRange1d(sources=[source.columns(“x”)])

ydr = DataRange1d(sources=[source.columns(“y”)])

plot = Plot(x_range=xdr, y_range=ydr, plot_width=800, plot_height=400)

line_f = Line(x=“x”, y=“y”, line_color=“blue”, line_width=2)

line_f_glyph = Glyph(data_source=source, xdata_range=xdr, ydata_range=ydr, glyph=line_f)

Adding a circle to the plot

circle_f = Circle(x=“x”, y=“y”, line_color=“red”, line_width=2)

circle_f_glyph = Glyph(data_source=ColumnDataSource({‘x’:0, ‘y’:0}), glyph=circle_f)plot.renderers.append(line_f_glyph)

#######

plot.renderers.append(line_f_glyph)

plot.renderers.append(circle_f_glyph)

xaxis = LinearAxis(plot=plot)

plot.below.append(xaxis)

yaxis = LinearAxis(plot=plot)

plot.left.append(yaxis)

Josh

–

You received this message because you are subscribed to the Google Groups “Bokeh Discussion - Public” group.

To unsubscribe from this group and stop receiving emails from it, send an email to bokeh+unsubscribe@continuum.io.

To post to this group, send email to bokeh@continuum.io.

To view this discussion on the web visit https://groups.google.com/a/continuum.io/d/msgid/bokeh/CAD4ivxWVz_9YmNvtzx66dMMdGyF36a%3DtiqPG3vc_wrFwyTtuNA%40mail.gmail.com.

For more options, visit https://groups.google.com/a/continuum.io/d/optout.

–

You received this message because you are subscribed to the Google Groups “Bokeh Discussion - Public” group.

To unsubscribe from this group and stop receiving emails from it, send an email to bokeh+unsubscribe@continuum.io.

To post to this group, send email to bokeh@continuum.io.

To view this discussion on the web visit https://groups.google.com/a/continuum.io/d/msgid/bokeh/53FF457B.8050407%40gmail.com.

For more options, visit https://groups.google.com/a/continuum.io/d/optout.

⌁   Link to post
Hugo_Shi
Hugo_Shi

You should be able to zoom - I was able to do so in the example that I showed you. I don't know alot about the hover tool, but I'm sure bryan does

···

On Thu 28 Aug 2014 11:40:27 AM EDT, Josh Wasserstein wrote:

Thanks! That works great. One thing I noticed is that I can't zoom nor
hover over the chart (I built my document from modifications to
taylor_server.py, which doesn't seem to support this either). Do you
know why?

Josh

On Thu, Aug 28, 2014 at 11:06 AM, Hugo Shi <hugo.r.shi@gmail.com > <mailto:hugo.r.shi@gmail.com>> wrote:

    btw what you're trying to do should be doable with the high level API.

    from bokeh.plotting import *
    output_file("line.html", title="line.py example")

    source = ColumnDataSource(data=dict(
        x = [-1, 1,2,3],
        y = [-1, 1,2,4]
    ))
    plot = line(x="x", y="y", line_color="blue", line_width=2,
    source=source, plot_width=800, plot_height=400)
    plot.circle(x="x", y="y", line_color="red", line_width=2,
    radius=0.2, source=source)
    show()

    On 08/28/2014 10:13 AM, Bryan Van de Ven wrote:

        Josh,

        the data needs to be a vector, also the glyph needs the ranges:

        from bokeh.objects import *
        from bokeh.glyphs import *

        source = ColumnDataSource(data=dict(
             x = [-1, 1,2,3],
             y = [-1, 1,2,4]
        ))

        xdr = DataRange1d(sources=[source.__columns("x")])
        ydr = DataRange1d(sources=[source.__columns("y")])

        plot = Plot(x_range=xdr, y_range=ydr, plot_width=800,
        plot_height=400)

        line_f = Line(x="x", y="y", line_color="blue", line_width=2)
        line_f_glyph = Glyph(data_source=source, xdata_range=xdr,
        ydata_range=ydr, glyph=line_f)
        plot.renderers.append(line_f___glyph)

        # Adding a circle to the plot
        circle_f = Circle(x="x", y="y", line_color="red",
        line_width=2, radius=0.2)
        circle_f_glyph =
        Glyph(data_source=__ColumnDataSource(data={'x':[0]__,
        'y':[0]}), xdata_range=xdr, ydata_range=ydr, glyph=circle_f)
        plot.renderers.append(circle___f_glyph)
        #######

        xaxis = LinearAxis(plot=plot)
        plot.below.append(xaxis)
        yaxis = LinearAxis(plot=plot)
        plot.left.append(yaxis)

        Note that a new PR just merged makes the lower level API a
        little easier to use.

        On Aug 28, 2014, at 9:05 AM, Josh Wasserstein > <ribonucleico@gmail.com <mailto:ribonucleico@gmail.com>> wrote:

            Sorry, I meant to say, that I tried this:

            plot = Plot(x_range=xdr, y_range=ydr, plot_width=800,
            plot_height=400)
            line_f = Line(x="x", y="y", line_color="blue", line_width=2)
            line_f_glyph = Glyph(data_source=source, xdata_range=xdr,
            ydata_range=ydr, glyph=line_f)
            plot.renderers.append(line_f___glyph)

            circle_f = Circle(x="x", y="y", line_color="red",
            line_width=2)
            circle_f_glyph =
            Glyph(data_source=__ColumnDataSource({'x':0, 'y':0}),
            glyph=circle_f)
            plot.renderers.append(circle___f_glyph)

            if I comment out the last three lines, everything works
            fine (I get axes labels)

            Josh

            On Thu, Aug 28, 2014 at 9:58 AM, Josh Wasserstein > <ribonucleico@gmail.com <mailto:ribonucleico@gmail.com>> > wrote:
            Hi,

            I am trying to add a circle to an existing plot with no
            luck. In fact, if I try to add a circle I get no axes (see
            image below). What am I doing wrong? <Screen Shot
            2014-08-28 at 9.57.35 AM.png>
            Here is the relevant part of the code

            source = ColumnDataSource(data=dict(
                 x = ,
                 y =
            ))

            xdr = DataRange1d(sources=[source.__columns("x")])
            ydr = DataRange1d(sources=[source.__columns("y")])

            plot = Plot(x_range=xdr, y_range=ydr, plot_width=800,
            plot_height=400)
            line_f = Line(x="x", y="y", line_color="blue", line_width=2)
            line_f_glyph = Glyph(data_source=source, xdata_range=xdr,
            ydata_range=ydr, glyph=line_f)

            # Adding a circle to the plot
            circle_f = Circle(x="x", y="y", line_color="red",
            line_width=2)
            circle_f_glyph =
            Glyph(data_source=__ColumnDataSource({'x':0, 'y':0}),
            glyph=circle_f)plot.renderers.__append(line_f_glyph)
            #######

            plot.renderers.append(line_f___glyph)
            plot.renderers.append(circle___f_glyph)

            xaxis = LinearAxis(plot=plot)
            plot.below.append(xaxis)
            yaxis = LinearAxis(plot=plot)
            plot.left.append(yaxis)

            Josh

            --
            You received this message because you are subscribed to
            the Google Groups "Bokeh Discussion - Public" group.
            To unsubscribe from this group and stop receiving emails
            from it, send an email to bokeh+unsubscribe@continuum.io
            <mailto:bokeh%2Bunsubscribe@continuum.io>__.
            To post to this group, send email to bokeh@continuum.io
            <mailto:bokeh@continuum.io>.
            To view this discussion on the web visit
            https://groups.google.com/a/__continuum.io/d/msgid/bokeh/__CAD4ivxWVz___9YmNvtzx66dMMdGyF36a%__3DtiqPG3vc_wrFwyTtuNA%40mail.__gmail.com
            <https://groups.google.com/a/continuum.io/d/msgid/bokeh/CAD4ivxWVz_9YmNvtzx66dMMdGyF36a%3DtiqPG3vc_wrFwyTtuNA%40mail.gmail.com&gt;\.
            For more options, visit
            https://groups.google.com/a/__continuum.io/d/optout
            <https://groups.google.com/a/continuum.io/d/optout&gt;\.

    --
    You received this message because you are subscribed to the Google
    Groups "Bokeh Discussion - Public" group.
    To unsubscribe from this group and stop receiving emails from it,
    send an email to bokeh+unsubscribe@continuum.io
    <mailto:bokeh%2Bunsubscribe@continuum.io>__.
    To post to this group, send email to bokeh@continuum.io
    <mailto:bokeh@continuum.io>.
    To view this discussion on the web visit
    https://groups.google.com/a/__continuum.io/d/msgid/bokeh/__53FF457B.8050407%40gmail.com
    <https://groups.google.com/a/continuum.io/d/msgid/bokeh/53FF457B.8050407%40gmail.com&gt;\.

    For more options, visit
    https://groups.google.com/a/__continuum.io/d/optout
    <https://groups.google.com/a/continuum.io/d/optout&gt;\.

--
You received this message because you are subscribed to the Google
Groups "Bokeh Discussion - Public" group.
To unsubscribe from this group and stop receiving emails from it, send
an email to bokeh+unsubscribe@continuum.io
<mailto:bokeh+unsubscribe@continuum.io>.
To post to this group, send email to bokeh@continuum.io
<mailto:bokeh@continuum.io>.
To view this discussion on the web visit
https://groups.google.com/a/continuum.io/d/msgid/bokeh/CAD4ivxXgOK6CuRQpfcO8X%3Dvdaho-c-9dgBW53OwcN646CLfqmg%40mail.gmail.com
<https://groups.google.com/a/continuum.io/d/msgid/bokeh/CAD4ivxXgOK6CuRQpfcO8X%3Dvdaho-c-9dgBW53OwcN646CLfqmg%40mail.gmail.com?utm_medium=email&utm_source=footer&gt;\.
For more options, visit https://groups.google.com/a/continuum.io/d/optout\.

⌁   Link to post

End of archived discussion · Replies are disabled
