Hi Community,
I am struggling with updating Vbar_stack plot in Bokeh. Here is an example, please could you let me know a solution for this ?
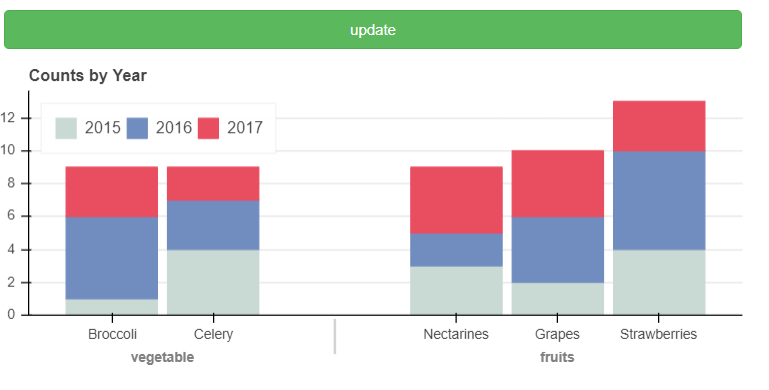
from bokeh.io import output_file, show
from bokeh.plotting import figure, ColumnDataSource
from bokeh.models import Button, FactorRange
from bokeh.layouts import column
 import pandas as pd

def update_data():

    data = {'2015': [1, 4, 3, 2, 4],
             '2016': [5, 3, 2, 4, 6],
             '2017': [3, 2, 4, 4, 3]}
    df = pd.DataFrame(data)
    index = [('vegetable','Broccoli'), ('vegetable','Celery'), ('fruits','Nectarines'), ('fruits','Grapes'), ('fruits','Strawberries')]
    df.index = index

    source.data = dict(ColumnDataSource(df).data)


output_file("bar_stacked.html")


years = ["2015", "2016", "2017"]
colors = ["#c9d9d3", "#718dbf", "#e84d60"]

data = {'2015': [2, 1, 4, 3, 2, 4],
     '2016': [5, 3, 4, 2, 4, 6],
     '2017': [3, 2, 4, 4, 5, 3]}

df = pd.DataFrame(data)

index = [('vegetable', 'Lettuce'), ('vegetable', 'Broccoli'), ('vegetable', 'Celery'), ('fruits', 'Nectarines'), ('fruits', 'Grapes'), ('fruits', 'Strawberries')]
df.index = index
source = ColumnDataSource(df)

p = figure(x_range=FactorRange(*df.index), plot_height=250, title="Counts by Year",
   toolbar_location=None, tools="hover", tooltips="$name @index: @$name")

p.vbar_stack(df.columns, x='index', width=0.9, color=colors, source=source,
     legend_label=years)

p.y_range.start = 0
p.x_range.range_padding = 0.1
p.xgrid.grid_line_color = None
p.axis.minor_tick_line_color = None
p.outline_line_color = None
p.legend.location = "top_left"
p.legend.orientation = "horizontal"

button = Button(label="update", button_type="success")
button.on_click(update_data)
layout = column(button, p)

show(p)
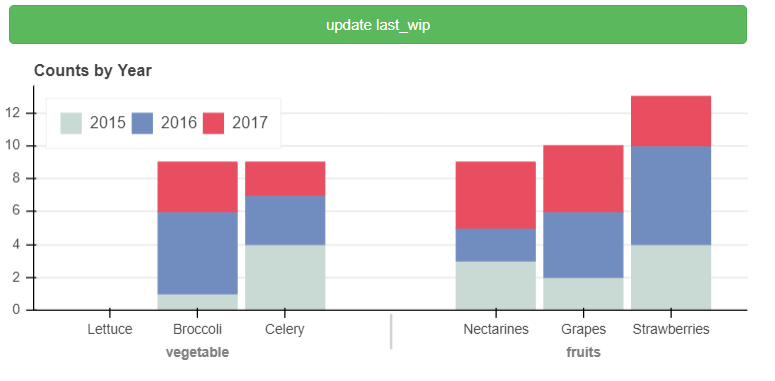
I would like to update the data with the function update_data. Please could you let me know a way to do this ?
As you can see, ‘Lettuce’ is still there.
Thank you,