Hi all,
I have following code generating a bar chart:
self.plot = figure(plot_height = HEIGHT,
plot_width = WIDTH,
tools=,
x_range = self.users,
x_axis_label = “User”,
y_axis_label = “Total anomalies”,
toolbar_location = None,
output_backend=‘webgl’)
self.plot.x_range.factors = list(self.users)
self.vbar = self.plot.vbar(x='value',top='count', bottom=0, source = self.source,
               color=palette[0], width=0.8)
Now this generates the following graph:
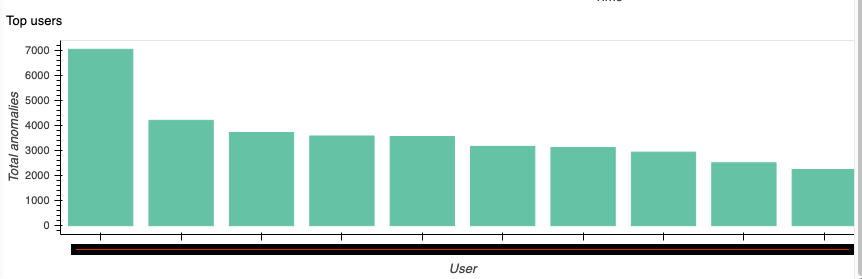
(have masked the x-axis label)
However if I update the source:
self.source.data.update(dataframe)
del self.vbar
palette = all_palettes['Set2'][6]
self.vbar = self.plot.vbar(x='value',top='count', bottom=0, source = self.source,
color=palette[0], width=0.8)
self.plot.x_range.factors = list(self.users)
and the dataframe now has different length, then I see the labels disappearing:
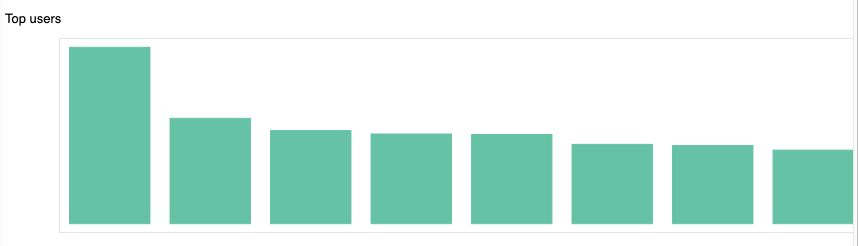
I get the following warning while running the bokeh server:
BokehUserWarning: ColumnDataSource’s columns must be of the same length. Current lengths: (‘count’, 8), (‘index’, 10), (‘value’, 8)
How do I get around this issue? Is there another way to update the datasource?
Edit:
Without creating a new vbar, and just creating a new source seem to fix the labels but doesn’t plot the graphs correctly.