

☰Read-only archive⌕
Looking for help with Bokeh?

This is a read-only archive. Ask questions and join the conversation on GitHub.

Visit Community Support on GitHub →
Archived discussions · Captured October 28, 2026

Updating interactive plot with varying datasize

Community Supportserverbokeh
codeyman
codeyman

Hi all,

I have following code generating a bar chart:
self.plot = figure(plot_height = HEIGHT,
plot_width = WIDTH,
tools=,
x_range = self.users,
x_axis_label = “User”,
y_axis_label = “Total anomalies”,
toolbar_location = None,
output_backend=‘webgl’)

self.plot.x_range.factors = list(self.users)
self.vbar = self.plot.vbar(x='value',top='count', bottom=0, source = self.source,
               color=palette[0], width=0.8)

Now this generates the following graph:
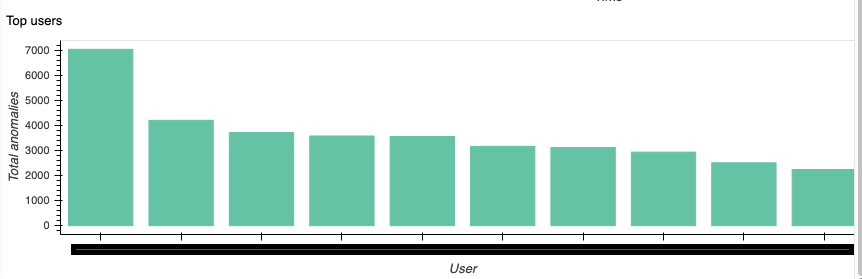

(have masked the x-axis label)

However if I update the source:
self.source.data.update(dataframe)
del self.vbar
palette = all_palettes['Set2'][6]
self.vbar = self.plot.vbar(x='value',top='count', bottom=0, source = self.source,
color=palette[0], width=0.8)
self.plot.x_range.factors = list(self.users)

and the dataframe now has different length, then I see the labels disappearing:
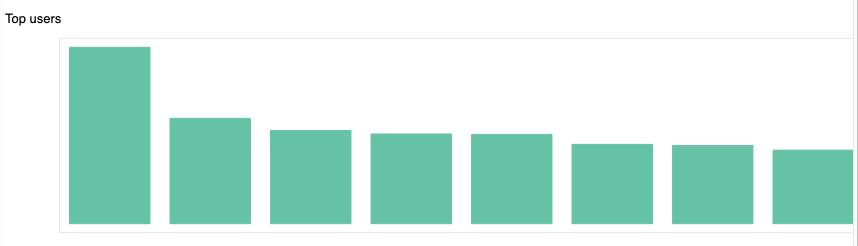
I get the following warning while running the bokeh server:
BokehUserWarning: ColumnDataSource’s columns must be of the same length. Current lengths: (‘count’, 8), (‘index’, 10), (‘value’, 8)

How do I get around this issue? Is there another way to update the datasource?

Edit:
Without creating a new vbar, and just creating a new source seem to fix the labels but doesn’t plot the graphs correctly.


⌁   Link to post
Bryan
Bryan

@codeyman unfortunately without a Minimal Reproducible Example, it’s often not really possible to offer any specific guidance. In this case you are (at least) making an update somewhere that results in inconsistent column lengths, but it’s not evident from just the information above where or why that is. The best I can offer is a a working toy example that is hopefully useful as a reference:

from bokeh.io import curdoc
from bokeh.layouts import column
from bokeh.models import Button, ColumnDataSource
from bokeh.plotting import figure

source = ColumnDataSource(data=dict(
    # both x any y columns have the same length
    x=["a", "b", "c"],
    y=[1, 3, 2],
))

p = figure(x_range=["a", "b", "c"])
p.vbar(x="x", top="y", width=0.8, source=source)

def update():
    source.data = dict(
        # new x and y columns have the same length
        x=["d", "e", "f", "g"],
        y=[4, 2, 3, 1],
    )
    p.x_range.factors = ["d", "e", "f", "g"]

b = Button()
b.on_click(update)

curdoc().add_root(column(p, b))
⌁   Link to post

End of archived discussion · Replies are disabled