Hello,
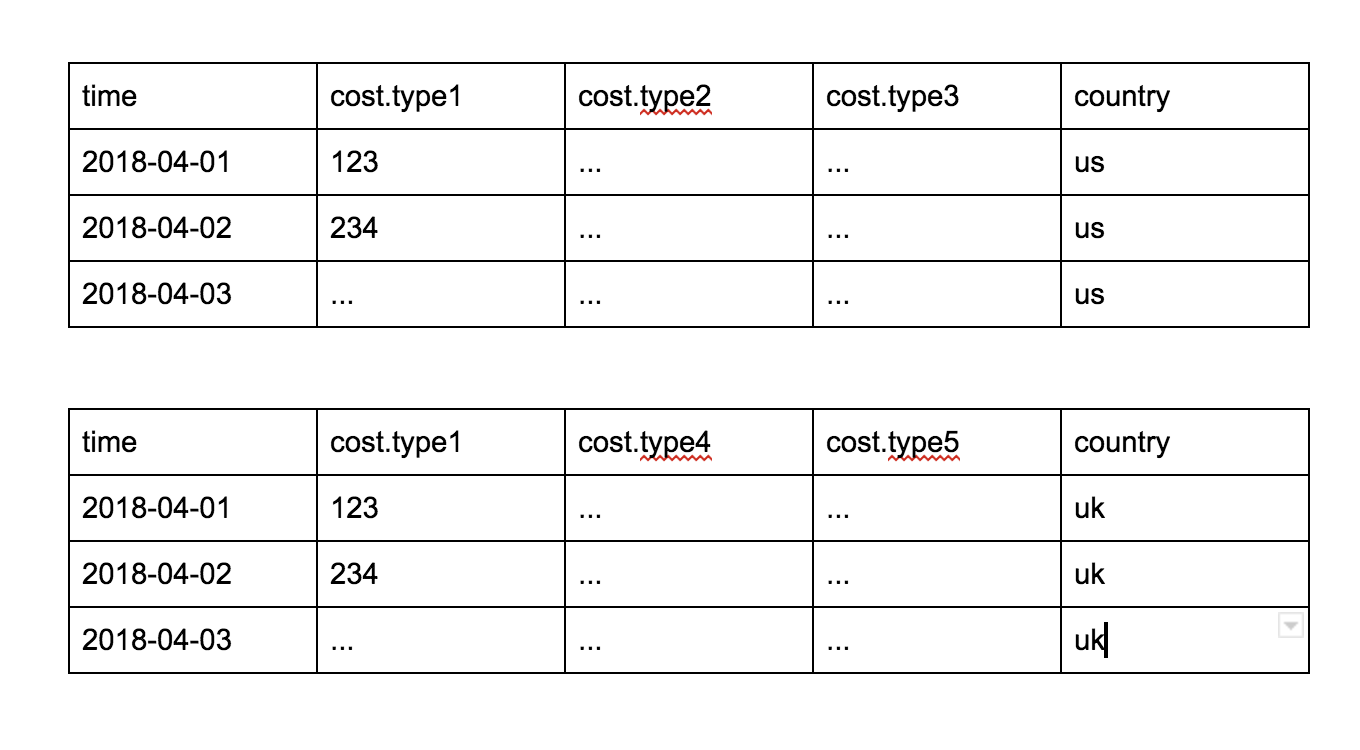
I have a use case where I have multiple line plots (with legends), and I need to update the line plots based on a column condition. Below is an example of two data set, based on the country, the column data source changes. But the issue I am facing is, the number of columns is not fixed for the data source, and even the types can vary. So, when I update the data source based on a callback when there is a new country selected, I get this error - " Error: attempted to retrieve property array for nonexistent field ‘pay_conv_7d.content’. I am guessing because in the new data source, the pay_conv_7d.content column doesn’t exist, but in my plot those lines were already there. I have been trying to fix this issue by various means (making common columns for all country selection - adding the missing column in the data source in callback, but still get issues.
Is there any clean way to have multiple line plots updating using callback, and not do a lot of hackish way? Any insights or help would be really appreciated. Thanks much in advance! 

Following is snippet:
def setup_multiline_plots(x_axis, y_axis, title_text, data_source, plot):

    num_categories = len(data_source.data['categories'])
    legends_list = list(data_source.data['categories'])
    colors_list = Spectral11[0:num_categories]
    # xs = [data_source.data['%s.'%x_axis].values] * num_categories
    # ys = [data_source.data[('%s.%s')%(y_axis,column)] for column in data_source.data['categories']]
    # data_source.data['x_series'] = xs
    # data_source.data['y_series'] = ys
    # plot.multi_line('x_series', 'y_series', line_color=colors_list,legend='categories', line_width=3, source=data_source)
    plot_list = []
    for (colr, leg, column) in zip(colors_list, legends_list, data_source.data['categories']):
        xs, ys = '%s.'%x_axis, ('%s.%s')%(y_axis,column)
        plot.line(xs,ys, source=data_source, color=colr, legend=leg, line_width=3, name=ys)
        plot_list.append(ys)
    data_source.data['plot_names'] = data_source.data.get('plot_names',[]) + plot_list
    plot.title.text = title_text
def update_plot(country, timeseries_df, timeseries_source,
aggregate_df, aggregate_source, category,
plot_pay_7d, plot_r_pay_90d):
aggregate_metrics = aggregate_df.loc[aggregate_df.country == country]
aggregate_metrics = aggregate_metrics.nlargest(10, 'cost')
category_types = list(aggregate_metrics[category].unique())
timeseries_df = timeseries_df[timeseries_df[category].isin(category_types)]
timeseries_multi_line_metrics = get_multiline_column_datasource(timeseries_df, category, country)

# len_series = len(timeseries_multi_line_metrics.data['time.'])
# previous_legends = timeseries_source.data['plot_names']
# current_legends = timeseries_multi_line_metrics.data.keys()
# common_legends = list(set(previous_legends) & set(current_legends))
# additional_legends_list = list(set(previous_legends) - set(current_legends))
# for legend in additional_legends_list:
#     zeros = pd.Series(np.array([0] * len_series), name=legend)
#     timeseries_multi_line_metrics.add(zeros, legend)
# timeseries_multi_line_metrics.data['plot_names'] = previous_legends

timeseries_source.data = timeseries_multi_line_metrics.data
aggregate_source.data = aggregate_source.from_df(aggregate_metrics)
def get_multiline_column_datasource(df, category, country):

    df_country = df[df.country == country]
    df_pivoted = pd.DataFrame(df_country.pivot_table(index='time', columns=category, aggfunc=np.sum).reset_index())
    df_pivoted.columns = df_pivoted.columns.to_series().str.join('.')
    categories = list(set([column.split('.')[1] for column in list(df_pivoted.columns)]))[1:]
    data_source = ColumnDataSource(df_pivoted)
    data_source.data['categories'] = categories

    return data_source
``