Hi,
I plot a time serie, along with a WheelZoomTool to zoom in & out (on the x_axis).
I’m trying to auto scale the y_range based on the line plot displayed.
import bokeh
import numpy as np
import pandas as pd

import bokeh.plotting

time_series = pd.Series(np.random.random(1000) - .49).cumsum().to_frame('data').rename_axis('ts').reset_index()
source_ref = bokeh.plotting.ColumnDataSource(data=time_series)
source_disp = bokeh.plotting.ColumnDataSource(data=time_series)

""" Define tools """
pan = bokeh.models.PanTool(dimensions='width')
wheel = bokeh.models.WheelZoomTool(dimensions='width', maintain_focus=True)

figure = bokeh.plotting.figure(title='Performance Report',
                               x_range=bokeh.models.Range1d(time_series.index[0], time_series.index[-1],
                                                            min_interval=15,
                                                            bounds=(time_series.index[0],  # set limit to range
                                                                    time_series.index[-1])),
                               tools=[pan, wheel],
                               active_drag=pan,
                               active_scroll=wheel,
                               y_axis_label='Plot',
                               x_axis_label='Time')

figure.line(x='index', y='data', source=source_disp)

figure.x_range.js_on_change('end',
                            bokeh.models.CustomJS(args={
                                # 'figure': figure,
                                'y_range': figure.y_range,
                                'source': source_ref,
                                'source_disp': source_disp},
                                code=
                                """
                                let i = Math.max(Math.floor(cb_obj.start), 0);
                                let j = Math.min(Math.ceil(cb_obj.end), source.data['data'].length);
                                let max = Math.max.apply(null, source.data['data'].slice(i, j));

                                const ref = source.data;
                                const data = source_disp.data;

                                data["index"] = ref["index"].slice(i, j);
                                data["ts"] = ref["ts"].slice(i, j);
                                data["data"] = ref["data"].slice(i, j);
                                source_disp.change.emit();

                                console.log("y_range end" + y_range.end);
                                y_range.end = max;
                                y_range.change.emit();
                                console.log("y_range end" + y_range.end);
                                console.log("end callback");
                                """
                            ))
bokeh.plotting.show(figure,
                    filename=filepath)
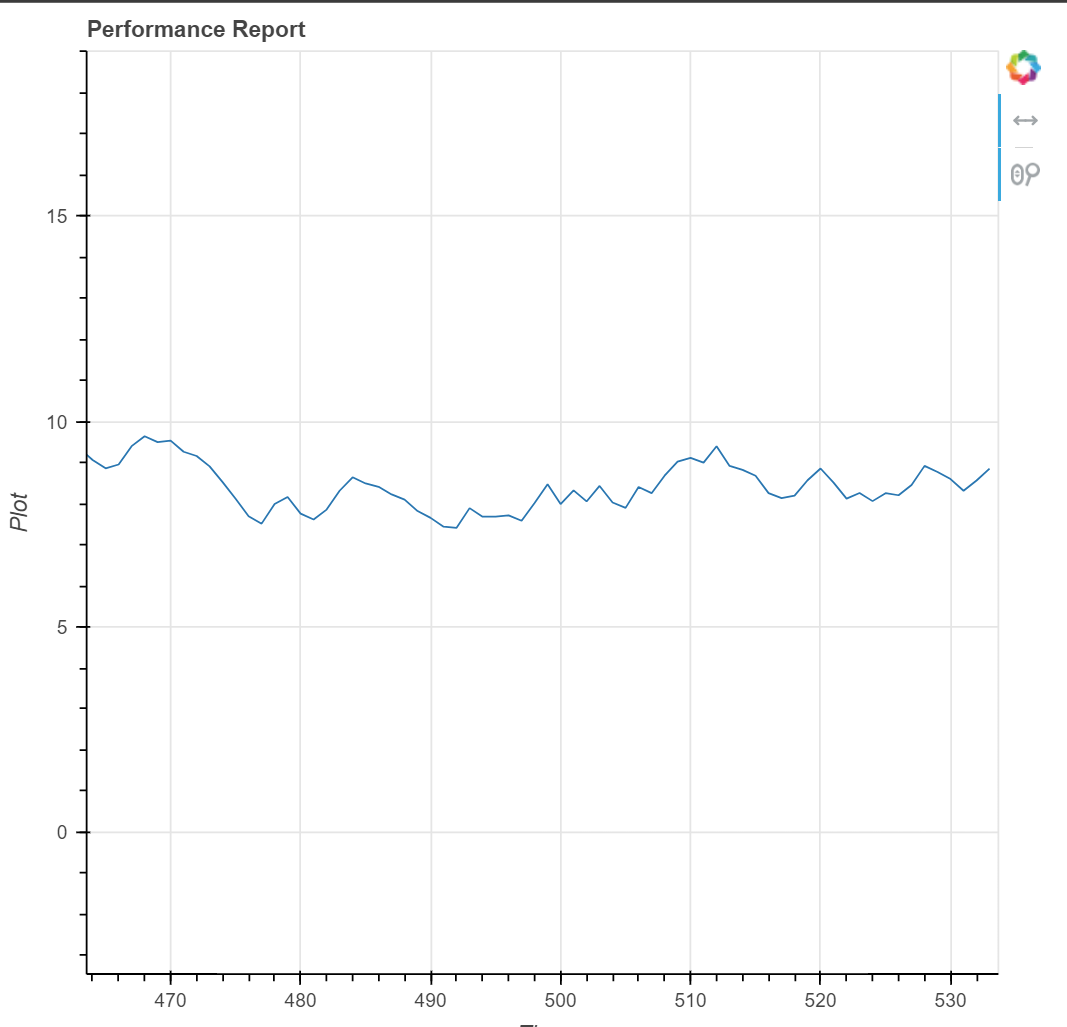
Here we can see that when I zoom in, the y_range scale does not adjust accordingly