Hi,
Some time ago I created a custom class for plotting images. The code is shown below (apologies for the length but it’s quicker to show it all than try to cut it down). Up to Bokeh 1.3.4 it worked fine but I just upgraded to 1.4 and the example fails with the following error in the browser console:
Error: Model ‘ColourMap.Column’ does not exist. This could be due to a widget or a custom model not being registered before first usage.
Any advice on how to fix this would be much appreciated!
The custom class:
'''ColourMap class definition'''

from bokeh.plotting import Figure

from bokeh.models import ColumnDataSource, Plot, ColorBar, HoverTool
from bokeh.models.mappers import LinearColorMapper
from bokeh.models.ranges import Range1d
from bokeh.models.layouts import Column
from bokeh.models.callbacks import CustomJS

from bokeh.core.properties import Instance, String, Float, Bool, Int

from bokcolmaps.get_common_kwargs import get_common_kwargs
from bokcolmaps.generate_colourbar import generate_colourbar
from bokcolmaps.read_colourmap import read_colourmap
from bokcolmaps.get_min_max import get_min_max


class ColourMap(Column):

    '''
    Plots an image as a colour map with a user-defined colour scale and
    creates a hover readout. The image must be on a uniform grid to be
    rendered correctly and for the data cursor to provide correct readout.
    '''

    __view_model__ = 'Column'
    __subtype__ = 'ColourMap'

    __sizing_mode__ = 'stretch_both'

    plot = Instance(Plot)
    cbar = Instance(ColorBar)

    datasrc = Instance(ColumnDataSource)
    cvals = Instance(ColumnDataSource)

    cmap = Instance(LinearColorMapper)

    title_root = String
    zlab = String

    rmin = Float
    rmax = Float
    autoscale = Bool

    xsize = Int
    ysize = Int
    zsize = Int

    cbdelta = Float

    js_hover = String

    cjs_slider = Instance(CustomJS)

    def __init__(self, x, y, z, dm, **kwargs):

        '''
        x,y and z are 1D NumPy arrays for the 3D grid dimensions.
        dm is a 3D NumPy array.
        Supply a bokeh palette name or a file of RGBA floats -
        this will be used if provided.
        xlab,ylab,zlab,dmlab: labels for the axes and data.
        height and width for the plot are in pixels.
        rmin and rmax are fixed limits for the colour scale
        (i.e. it won't autoscale if they are both not None).
        xran and yran: ranges for the x and y axes (e.g. to link to
        another plot).
        hover: enable hover tool readout.
        '''

        palette, cfile, xlab, ylab, zlab,\
            dmlab, rmin, rmax, xran, yran = get_common_kwargs(**kwargs)

        height = kwargs.get('height', 575)
        width = kwargs.get('width', 500)
        hover = kwargs.get('hover', True)

        super().__init__()

        self.cbdelta = 0.01  # Min colourbar range (used if values are equal)

        self.title_root = dmlab
        self.zlab = zlab

        self.rmin = rmin
        self.rmax = rmax
        self.autoscale = True
        if (self.rmin is not None) and (self.rmax is not None):
            self.autoscale = False

        if len(dm.shape) == 2:
            self.ysize, self.xsize = dm.shape
            self.zsize = 1
        elif len(dm.shape) == 3:
            self.zsize, self.ysize, self.xsize = dm.shape

        if len(dm.shape) > 2:  # Default to first slice
            d = dm[0]
        else:
            d = dm

        dm = dm.flatten()

        # All variables stored as single item lists in order to be the same
        # length (as required by ColumnDataSource)
        self.datasrc = ColumnDataSource(data={'x': [x], 'y': [y], 'z': [z],
                                              'image': [d], 'dm': [dm],
                                              'xp': [0], 'yp': [0], 'dp': [0]})

        self.get_cmap(cfile, palette)

        if xran is None:  # Default to whole range unless externally controlled
            xran = Range1d(start=x[0], end=x[-1])
        if yran is None:
            yran = Range1d(start=y[0], end=y[-1])

        ptools = ['reset,pan,wheel_zoom,box_zoom,save']

        # JS code defined whether or not hover tool used as may be needed in
        # class ColourMapLP

        self.js_hover = '''
        var geom = cb_data['geometry'];
        var data = datasrc.data;

        var hx = geom.x;
        var hy = geom.y;

        var x = data['x'][0];
        var y = data['y'][0];
        var d = data['image'][0];

        var dx = x[1] - x[0];
        var dy = y[1] - y[0];
        var xind = Math.floor((hx + dx/2 - x[0])/dx);
        var yind = Math.floor((hy + dy/2 - y[0])/dy);

        if ((xind < x.length) && (yind < y.length)) {
            data['xp'] = [x[xind]];
            data['yp'] = [y[yind]];
            var zind = yind*x.length + xind;
            data['dp'] = [d[zind]];
        }
        '''

        if hover:
            cjs_hover = CustomJS(args={'datasrc': self.datasrc},
                                 code=self.js_hover)
            htool = HoverTool(tooltips=[(xlab, '@xp{0.00}'),
                                        (ylab, '@yp{0.00}'),
                                        (dmlab, '@dp{0.00}')],
                              callback=cjs_hover, point_policy='follow_mouse')
            ptools.append(htool)

        self.plot = Figure(x_axis_label=xlab, y_axis_label=ylab,
                           x_range=xran, y_range=yran,
                           plot_height=height, plot_width=width,
                           tools=ptools, toolbar_location='right')

        self.update_title(0)

        self.plot.title.text_font = 'garamond'
        self.plot.title.text_font_size = '12pt'
        self.plot.title.text_font_style = 'bold'
        self.plot.title.align = 'center'

        dx = abs(x[1] - x[0])
        dy = abs(y[1] - y[0])

        pw = abs(x[-1] - x[0]) + dx
        ph = abs(y[-1] - y[0]) + dy

        # The image is displayed such that x and y coordinate values
        # correspond to the centres of rectangles

        xs = xran.start
        if xs is None:
            xs = 0
        elif xran.end > xran.start:
            xs -= dx / 2
        else:
            xs += dx / 2
        ys = yran.start
        if ys is None:
            ys = 0
        elif yran.end > yran.start:
            ys -= dy / 2
        else:
            ys += dy / 2

        self.plot.image('image', source=self.datasrc, x=xs, y=ys,
                        dw=pw, dh=ph, color_mapper=self.cmap)

        # Needed for HoverTool...
        self.plot.rect(x=(x[0] + x[-1]) / 2, y=(y[0] + y[-1]) / 2, width=pw, height=ph,
                       line_alpha=0, fill_alpha=0, source=self.datasrc)

        self.plot.xaxis.axis_label_text_font = 'garamond'
        self.plot.xaxis.axis_label_text_font_size = '10pt'
        self.plot.xaxis.axis_label_text_font_style = 'bold'

        self.plot.yaxis.axis_label_text_font = 'garamond'
        self.plot.yaxis.axis_label_text_font_size = '10pt'
        self.plot.yaxis.axis_label_text_font_style = 'bold'

        self.cbar = generate_colourbar(self.cmap, cbarwidth=round(height / 20))
        self.plot.add_layout(self.cbar, 'below')

        self.children.append(self.plot)

    def get_cmap(self, cfile, palette):

        '''Get the colour mapper'''

        if self.autoscale:
            min_val, max_val = get_min_max(self.datasrc.data['image'][0],
                                           self.cbdelta)
        else:
            min_val = self.rmin
            max_val = self.rmax

        if cfile is not None:
            self.read_cmap(cfile)
            self.cmap = LinearColorMapper(palette=self.cvals.data['colours'])
        else:
            self.cmap = LinearColorMapper(palette=palette)
        self.cmap.low = min_val
        self.cmap.high = max_val

    def read_cmap(self, fname):

        '''
        Read in the colour scale.
        '''

        self.cvals = read_colourmap(fname)

    def change_slice(self, zind):

        '''
        Change the 2D slice of D being displayed (i.e. a different value of z)
        '''

        if (self.zsize > 1) and (zind >= 0) and (zind < self.zsize):
            zindl = zind * self.xsize * self.ysize
            dms = self.datasrc.data['dm'][0][zindl:zindl + self.xsize * self.ysize]
            self.datasrc.patch({'image': [(0, dms)]})

    def update_cbar(self, zind):

        '''
        Update the colour scale (needed when the data for display changes).
        '''

        if self.autoscale:
            d = self.datasrc.data['dm'][0][zind * self.xsize * self.ysize:
                                           (zind + 1) * self.xsize * self.ysize]
            min_val, max_val = get_min_max(d, self.cbdelta)
            self.cmap.low = min_val
            self.cmap.high = max_val

    def update_title(self, zind):

        if len(self.datasrc.data['z'][0]) > 1:
            self.plot.title.text = self.title_root + ', ' + \
                self.zlab + ' = ' + str(self.datasrc.data['z'][0][zind])
        else:
            self.plot.title.text = self.title_root

    def input_change(self, attrname, old, new):

        '''
        Callback for use with e.g. sliders.
        '''

        self.change_slice(new)
        self.update_cbar(new)
        self.update_title(new)
Example use of the class:
import numpy

from bokeh.plotting import show
from bokeh.palettes import Viridis256

from bokcolmaps.ColourMap import ColourMap
from bokcolmaps.Examples import example_data

x, y, z, D = example_data()
D = D[0]  # Data for first value of z
z = numpy.array([z[0]])  # First value of z

cm = ColourMap(x, y, z, D, cfile=None, palette=Viridis256,
               xlab='x val', ylab='y val', zlab='power val',
               dmlab='Function val')

show(cm)
The example data:
import numpy

def example_data():

    x = numpy.linspace(1, 2, 11)  # x and y must be uniformly spaced for ColourMap class
    y = numpy.linspace(2, 4, 21)
    z = numpy.array([0.5, 0.8, 1, 1.5, 2.5, 3.1])  # z can be non-uniformly spaced
    nx, ny, nz = x.size, y.size, z.size

    D = numpy.ndarray([nz, ny, nx])

    for i in range(nz):
        for j in range(ny):
            for k in range(nx):
                D[i, j, k] = (y[j]*x[k])**z[i]

    return x, y, z, D
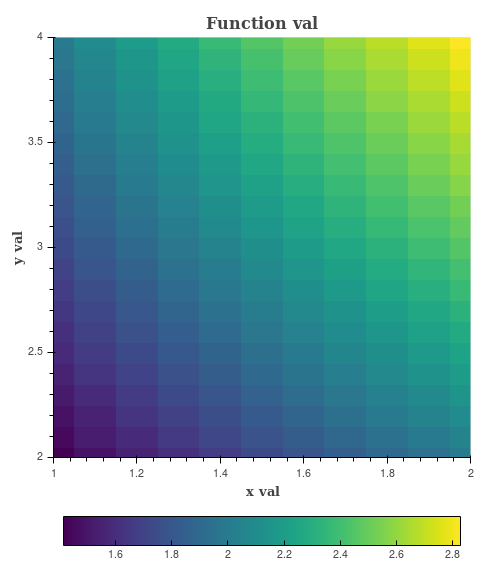
…and if it all works, running the example should give the image below…