I’ve got two plots, one of which has a scatter glyph and another with a patches glyph. They’re both generated from the same datasource, so if the user makes a selection, the selection will carry over to the other plot as well.
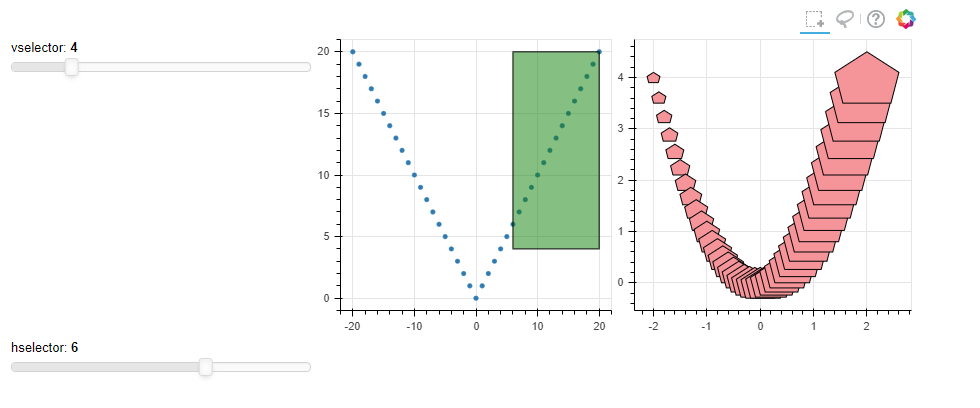
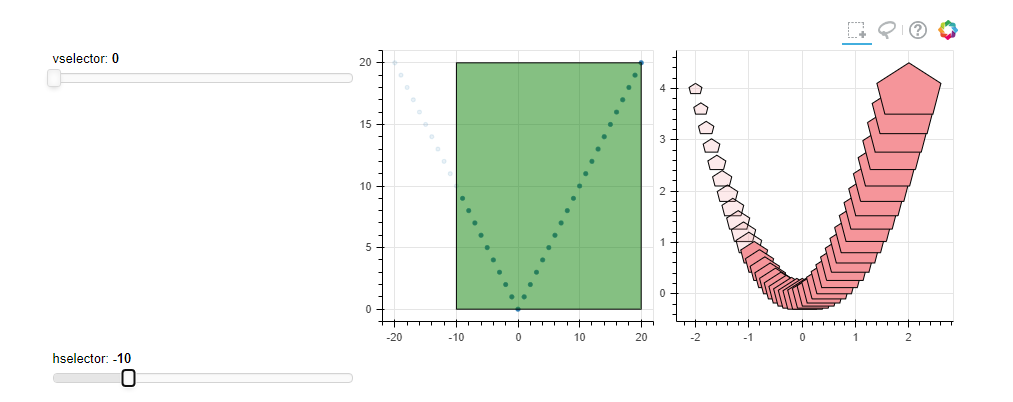
What I want to do is have two sliders that can adjust the size of a box selection in the scatter figure. Hslider will move the box selection left and right, Vslider up and down. I have a working example here (see below) where I’m just making a Quad glyph and changing its bottom and left props with the two sliders.
I basically want whatever is inside this quad to be the box selection but don’t know how to proceed. I want to stay with CustomJS only (standalone). Any help greatly appreciated.
PS i really actually want the Vslider oriented vertically but that appears to be broken (vertical slider · Issue #7127 · bokeh/bokeh · GitHub)
> from bokeh.io import output_notebook, show
> import numpy as np
> from bokeh.layouts import gridplot
> from bokeh.models import ColumnDataSource, Patches, Slider, Quad
> from bokeh.plotting import figure
>
> output_notebook()
>
> #points
> x = list(range(-20, 21))
> y = [abs(xx) for xx in x]
>
> #making patches
> N =41
> xp = np.linspace(-2, 2, N)
> yp = xp**2
> xpts = np.array([-.09, -.12, .0, .12,  .09])
> ypts = np.array([-.1,   .02, .1, .02, -.1])
>
> source = ColumnDataSource(dict(x=x,y=y,
>         xs=[xpts*(1+i/10.0)+xx for i, xx in enumerate(xp)],
>         ys=[ypts*(1+i/10.0)+yy for i, yy in enumerate(yp)],
>     ))
>
>
> TOOLS = "box_select,lasso_select,help"
>
> # create a new plot and add a renderer
> left = figure(tools=TOOLS, plot_width=300, plot_height=300, title=None)
> left.circle('x', 'y', source=source)
>
> # create another new plot and add a renderer
> right = figure(tools=TOOLS, plot_width=300, plot_height=300, title=None)
> glyph = Patches(xs="xs", ys="ys", fill_color="#fb9a99")
> right.add_glyph(source, glyph)
>
> #create the selection "quad"
> qsource = ColumnDataSource({'bottom':[0],'top':[20],'left':[-20],'right':[20]})
> selector = Quad(bottom='bottom',top='top',left='left',right='right',fill_color='green',fill_alpha=0.5)
> renderer = left.add_glyph(qsource,selector)
>
> hslider = Slider(start=-20, end=20, value=-20, step=1, title="hselector")
> vslider = Slider(start=0,end=20,value=0,step=1,title='vselector')
>
> hcallback = CustomJS(args=dict(renderer=renderer), code="""
>     renderer.glyph.left = cb_obj.value;
> """)
> hslider.js_on_change('value',hcallback)
> vcallback = CustomJS(args=dict(renderer=renderer), code="""
>     renderer.glyph.bottom = cb_obj.value;
> """)
> vslider.js_on_change('value',vcallback)
>
> p = gridplot([[vslider,left, right],[hslider]])
>
> show(p)