Also as a reference,
here’s a complete minimal example showing an
updating span based on a slider that was
posted on Stack Overflow the other day:
[http://stackoverflow.com/a/39235127/3406693](http://stackoverflow.com/a/39235127/3406693)
Thanks,
Bryan
> On Sep 4, 2016, at 11:26 PM, Sarah
Bird - Continuum <[email protected] >
wrote:
            >

            > Hi Angelo,

            >

            > Thanks for sharing.

            >

            > You're code's pretty long so it's too much for me
to debug.
            >

            > A couple of things though:

            >

            > 1) as soon as you change the metric select dropdown
it causes some kind of
pingponging so there’s a loop in your code
somewhere - this is what’s responsible for
the flashin axis I believe - although it’s
pretty strange and I don’t quite
understand it (You can see this by using
the chrome web developer tools and
selecting the websocket under the network
tab.
            >

            > 2) I don't see any annotation in the code you sent
so it’s hard for me to
comment, but I would suggest that you
shouldn’t be removing an annotation and
drawing a second one, but rather setting a
new x / y coordinate for your annotation.
            >

            > Sincerely,

            >

            > Sarah Bird

            >

            > On 9/3/16 7:12 PM, Angelo Fausti Neto wrote:

            >> Hi all,

            >>

            >> in my previous message I mentioned an issue
using annotations in a
bokeh app, here I provide more information
and a complete example to reproduce the
problem.
>>
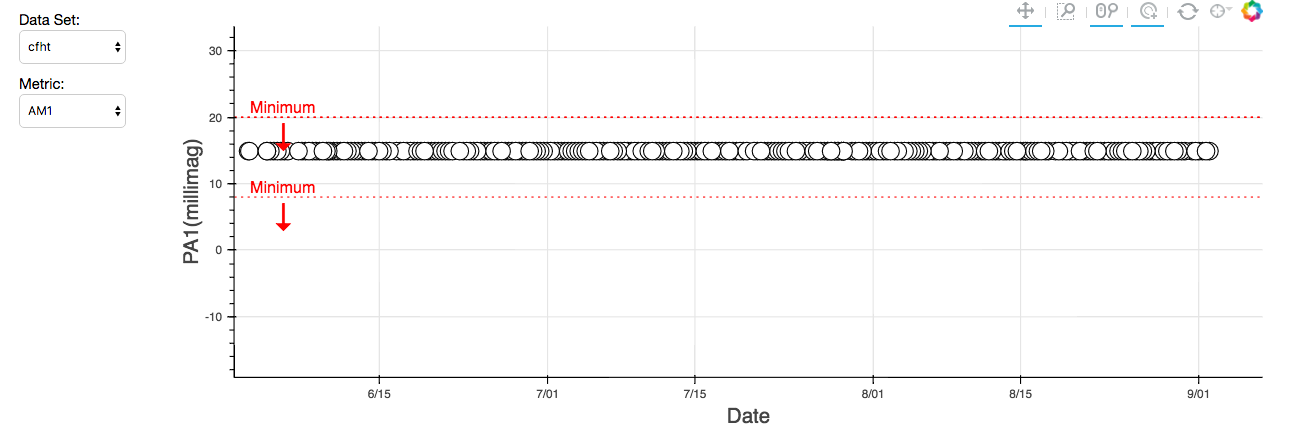
>> The attached screenshot
illustrates what happens. If I change the
“Metric” select widget it draws the second
annotation, but I cannot remove the
previous one. Another problem is that the
plot start ‘blinking’.
            >>

            >> The app is here

            >>

            >> [https://github.com/lsst-sqre/qa-dashboard/blob/tickets/DM-7427/squash/dashboard/viz/metrics.py](https://github.com/lsst-sqre/qa-dashboard/blob/tickets/DM-7427/squash/dashboard/viz/metrics.py)

            >>

            >> see the methods draw_spec_annotations() and
on_metric_change()
            >>

            >> use the following to run, it requires

            >>

            >> bokeh==0.12.1

            >> requests==2.9.1

            >>

            >> $ export SQUASH_API_URL=[https://squash.lsst.codes/dashboard/api/](https://squash.lsst.codes/dashboard/api/)
(this give you some data to feed the plot)

            >>

            >> $ bokeh serve metrics.py

            >>

            >> If I could configure the annotations using a
data source then
perhaps changing the datasource would
update the plot correctly, but following
the documentation it seems not possible in
the current bokeh version.
            >>

            >> [http://bokeh.pydata.org/en/0.12.1/docs/reference/models/annotations.html#bokeh.models.annotations.Span](http://bokeh.pydata.org/en/0.12.1/docs/reference/models/annotations.html#bokeh.models.annotations.Span)

            >>

            >> any suggestions on how to do that?

            >>

            >>

            >> Angelo Fausti Neto

            >> LIneA/LSST

            >>

            >>

            >>

            >> On Tue, Aug 30, 2016 at 1:28 PM, Angelo Fausti
Neto <[email protected] >
wrote:
            >> Hi,

            >>

            >> I am trying to use span annotations in a bokeh
app to draw
threshold lines in a time series plot, I
have a select widget and would like to
change the value of the threshold when the
selection changes.
            >>

            >> I noticed that I cannot configure a span
annotation with a data source, so I
do:
            >>

            >> minimum = 1

            >> threshold = Span( location=minimum,
dimension=‘width’
            >> ,

            >>

            >> line_width=1, line_color='red'

            >> ,

            >>

            >> line_dash='dotted'

            >> ,)

            >>

            >>

            >> self.plot.add_layout(threshold)

            >>

            >> then I change the selection and it draws the
new annotation but I don’t
know how to remove the previous one.
            >>

            >> what is the solution for that?

            >>

            >> Angelo Fausti Neto

            >> LIneA/LSST

            >>

            >>

            >>

            >> --

            >> You received this message because you are
subscribed to the Google Groups
“Bokeh Discussion - Public” group.
>> To unsubscribe from this group
and stop receiving emails from it, send an
email to [email protected].
>> To post to this group, send email
to [email protected].
>> To view this discussion on the
web visit https://groups.google.com/a/continuum.io/d/msgid/bokeh/CAD%3DOK5Mi1a1kLAZb8DB3y38D6UQ9QBGLOEmV8a1f%2B_AvBJbWbw%40mail.gmail.com.
                          >> For more options, visit [https://groups.google.com/a/continuum.io/d/optout](https://groups.google.com/a/continuum.io/d/optout).

                          >

                          > --

                          > Sarah Bird

                          > Developer, Bokeh

                          >

                          >

                          >

                          >