
☰Read-only archive⌕
Looking for help with Bokeh?

This is a read-only archive. Ask questions and join the conversation on GitHub.

Visit Community Support on GitHub →
Archived discussions · Captured October 28, 2026

VERY big data plotting

Community Support
KonradCurze
KonradCurze

Hello everyone!

I am trying to plot a huge amount of data. We are talking about a million lines with a thousand samples each. that is, shape = (10e6,10e3).
Obviously, you can’t put it into one plot right away. But the important point is that this is a very elongated drawing. Like a ribbon.
I had an idea. Having loaded ALL data when drawing, display only, for example, 100 lines and then, when interacting with the slider, dynamically draw another 100 lines. That is, in fact, move in a certain window as in the diagram below
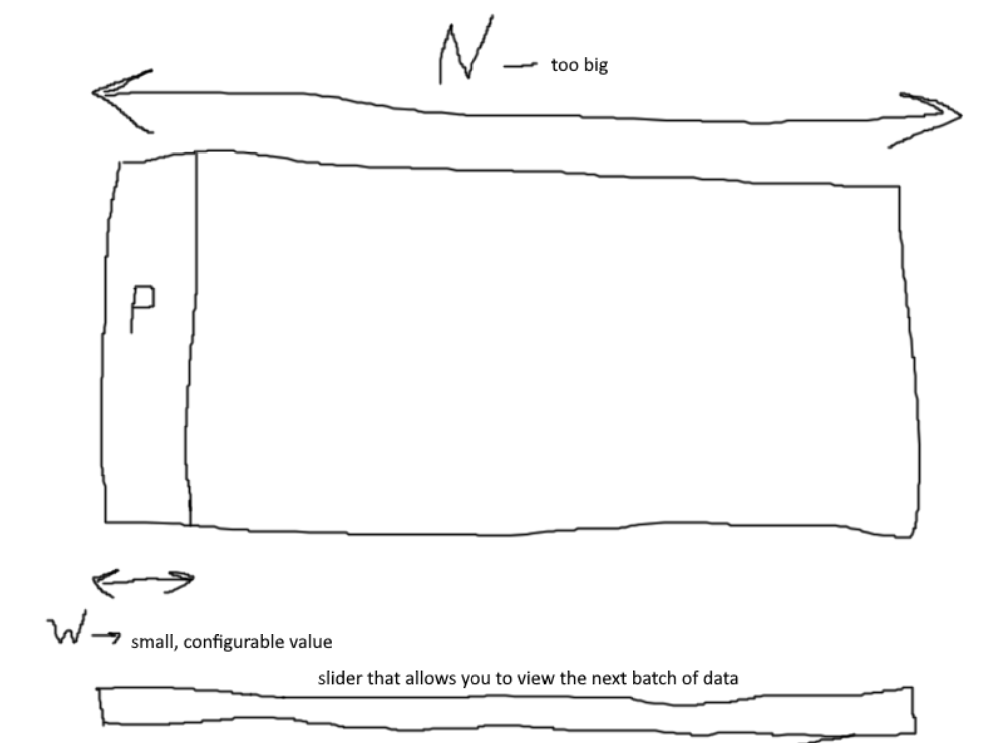

Please also note that this plot will support interactive, that is. But I am not giving this in example below.

The question is how to actually do this. Dynamically draw data in a window.
Below is an example of the code on a number of random lines.


import numpy as np
from bokeh.io import  push_notebook,show,output_notebook
from bokeh.layouts import gridplot
from bokeh.plotting import figure,show,ColumnDataSource
from bokeh.models import MultiLine, Grid, LinearAxis
N=100
Traces=np.random.rand(N,1000)

length=np.arange(0,len(Traces[0]))
step = 5
Num_of_traces = len(Traces)
clip = step-0.1

#The code is strange here because a piece of additional operations was cut
Trace_mass=[]
Time_mass=[]
for k in range(Num_of_traces):
    Trace_mass.append(Traces[k])
    Time_mass.append(np.arange(1000)) 

###############################################################################    
source_L = ColumnDataSource(dict(
        xs=[Traces[i]+step*i for i in range(Num_of_traces)],
        ys=[Time_mass[i] for i in range(Num_of_traces)]

    )
)
###############################################################################

output_notebook()
plot = figure( title='example',plot_width=1600, plot_height=800, x_range=(0-5, N*step+5))

glyph_L = MultiLine(xs="xs", ys="ys", line_color="#8073ac", line_width=2)
L=plot.add_glyph(source_L, glyph_L)


point_attributes = ['x','y']

xaxis = LinearAxis()
plot.add_layout(xaxis, 'above')

yaxis = LinearAxis()
plot.add_layout(yaxis, 'right')

plot.add_layout(Grid(dimension=0, ticker=xaxis.ticker))
plot.add_layout(Grid(dimension=1, ticker=yaxis.ticker))

plot.y_range.flipped = True

show(plot)    
⌁   Link to post
_jm
_jm

@KonradCurze

See the Appending data to a ColumnDataSource section of the Providing data page in the bokeh users guide. https://docs.bokeh.org/en/latest/docs/user_guide/data.html

I’d start with looking at whether the stream() mechanism can be made to work for your use case.


Appending data to a ColumnDataSource

ColumnDataSource streaming is an efficient way to append new data to a ColumnDataSource. When you use the stream() method, Bokeh only sends new data to the browser instead of sending the entire dataset.

⌁   Link to post
KonradCurze
KonradCurze

I need to not only look at the data, but also change it when working with it. Operations are simple but require callback functions. Such an array of data is difficult not only to display but also to change.

Again, the scale required to view the graph is rather small (as I showed in the figure). This is exactly the option that is needed. that is, I don’t want to look at billions of points at once. I want to dynamically display thousands of them and also change them.

Although your advice will come in handy anyway, the task here is a little different.
I found a solution, but then when the interaction with them (those same callback functions) increases, it starts to work slowly. And it looks obscene. I was hoping for a better solution.

import numpy as np
from bokeh.io import  push_notebook,show,output_notebook
from bokeh.layouts import gridplot,column, row
from bokeh.plotting import figure,show,ColumnDataSource
from bokeh.models import MultiLine, Grid, LinearAxis,Slider,CustomJS

start_trace=0
wind=25
N=300

Traces=np.random.rand(N,1000)
Traces[10]=Traces[10]*5

length=np.arange(0,len(Traces[0]))
step = 5
Num_of_traces = len(Traces)
clip = step-0.1

#The code is strange here because a piece of additional operations was cut
Trace_mass=[]
Time_mass=[]
for k in range(Num_of_traces):
    Trace_mass.append(Traces[k])
    Time_mass.append(np.arange(1000)) 

###############################################################################    
source_L = ColumnDataSource(dict(
        xs=[Traces[i]+step*i for i in range(start_trace,start_trace+wind)],
        ys=[Time_mass[i] for i in range(start_trace,start_trace+wind)]

    )
)

source_copy_L = ColumnDataSource(dict(
        xs=[Traces[i]+step*i for i in range(N)],
        ys=[Time_mass[i] for i in range(N)]

    )
)


###############################################################################

trace_slider = Slider(start=0., end=len(Traces)-wind, value=1., step=1, title="Trace_Slider",default_size=(50))


output_notebook()
plot = figure( title='example',plot_width=1600, plot_height=800)

glyph_L = MultiLine(xs="xs", ys="ys", line_color="#8073ac", line_width=2)
L=plot.add_glyph(source_L, glyph_L)
##################################################################
callback = CustomJS(args=dict(start_trace=start_trace,window=wind,tr_slide=trace_slider,source_L=source_L,source_copy_L=source_copy_L ),
                    code="""
    var start_trace=start_trace;
    var window=window;  

    var Tr = tr_slide.value;      
    source_L.data['xs'] = source_copy_L.data['xs'].slice(start_trace+Tr, start_trace+Tr+window)
    
    source_L.change.emit();
       
 
""")

###################################################################
trace_slider.js_on_change('value', callback)
point_attributes = ['x','y']

xaxis = LinearAxis()
plot.add_layout(xaxis, 'above')

yaxis = LinearAxis()
plot.add_layout(yaxis, 'right')

plot.add_layout(Grid(dimension=0, ticker=xaxis.ticker))
plot.add_layout(Grid(dimension=1, ticker=yaxis.ticker))

layout1 = row(
column(plot,trace_slider),

)

plot.y_range.flipped = True

show(layout1,notebook_handle=True)  
⌁   Link to post
Bryan
Bryan

@KonradCurze If all you need is streaming, then FYI there was an issue raised just yesterday about adding support for streaming to MultiLine:

[FEATURE] Add support for "coordinate" data streaming for ColumnDataSource with MultiLine · Issue #11101 · bokeh/bokeh · GitHub

However, streaming is only for appending new data efficient to the end of an existing series. If you want to be able to interactively scrub the display the back and forth, streaming is not going to suffice. I would just reiterate my earlier suggestion of Holoviews+Datashader since they have already done all the hard took to afford interactivity over large data sets. E.g. I don’t really understand this comment:

I need to not only look at the data, but also change it when working with it.

Since Holoview+Datashader can definitely be interactive (pan zoomable, automatically updates for visible viewport, re-render on new data, etc)

⌁   Link to post
James_A_Bednar1
James_A_Bednar1

Right, you can definitely use HoloViews + Datashader to display a small viewport of a much larger dataset, with only the currently visible portion passed into the browser. With the right file format and using a Dask array or dataframe with regular sampling along N, it should even be feasible to avoid ever loading into Python memory the portion of the data that you aren’t using, lazily leaving that on disk until you pan over to that range (though I haven’t actually tried that).

Then once you have displayed the values in a window, Bokeh will be working in the global N coordinate system even though only W samples are currently displayed, and so if you use the annotation and drawing tools to collect inputs from the user about how you want those values to change, it should be easy enough to take those inputs, change the underlying large data structure, and have the results update.

I think this is a case where we should create examples in HoloViews or hvPlot showing how to do this, and in particular how to enforce a maximum size on w so that no one can zoom out and thus trigger the entire set of data to display (with potentially disastrous consequences). But it’s definitely nearly there already, and at most needs some tweaking.

⌁   Link to post

End of archived discussion · Replies are disabled