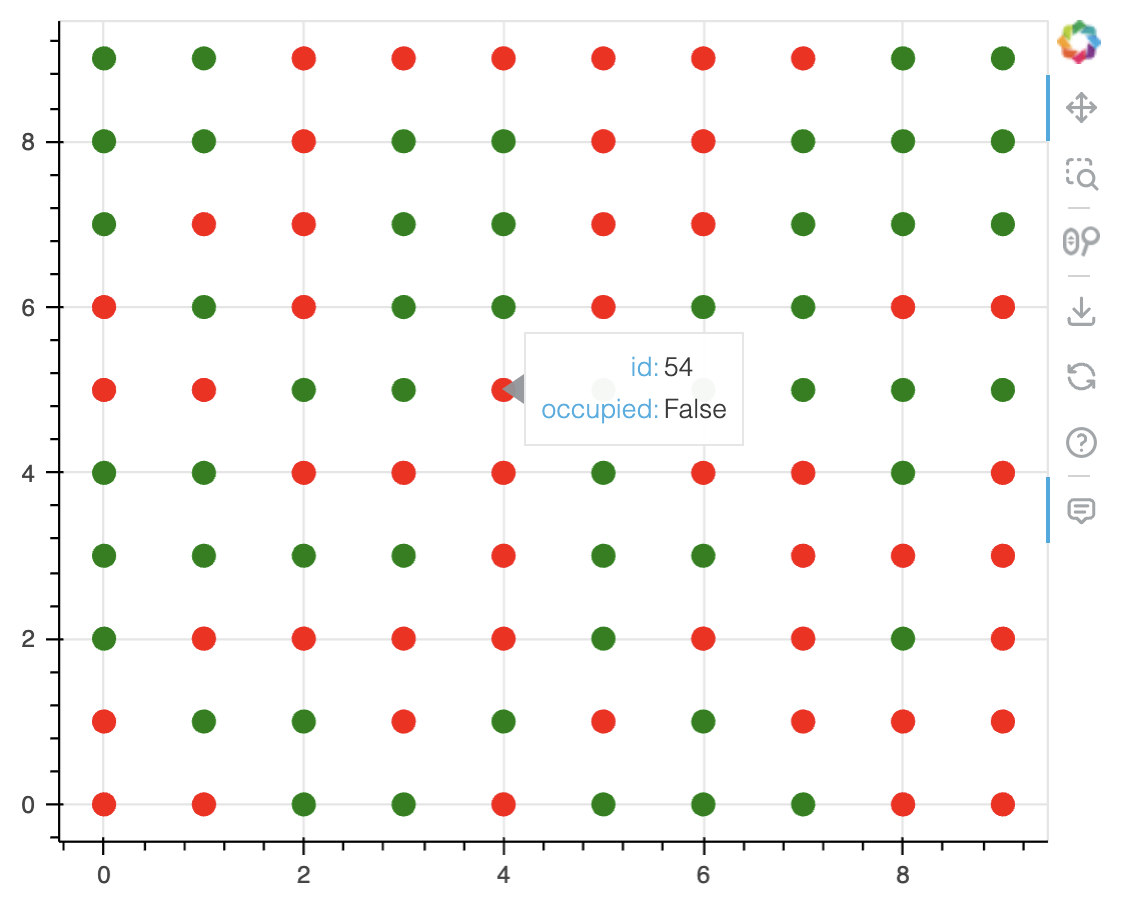
Without knowing much about structure of your data and application, here are my thoughts: do you have coordinates associated with each parking space? if so, you can create a dataframe with columns id, x_coordinate, y_coordinate, is_occupied and map True/False for is_occupied to different colors like green/red and plot each space as a circle with appropriate color:
from bokeh.plotting import figure
from bokeh.models import ColumnDataSource, HoverTool
from bokeh.io import output_notebook, show
output_notebook()

n_spots = 100
x, y = np.meshgrid(np.arange(0, 10), np.arange(0, 10))

df = pd.DataFrame({
    'id': np.arange(n_spots),
    'x_coordinate': np.reshape(x, (100,)),
    'y_coordinate': np.reshape(y, (100,)),
    'is_occupied': np.random.choice([True, False], n_spots)
})
df['color'] = df['is_occupied'].map({True: 'green', False: 'red'})
df['is_occupied'] = df['is_occupied'].map({True: 'True', False: 'False'})

source = ColumnDataSource(data=df)
p = figure(width=500, height=400)
p.circle(x='x_coordinate', y='y_coordinate', color='color', source=source, size=10)

h = HoverTool(tooltips=[('id', '@id'), ('occupied', '@is_occupied')])
p.add_tools(h)

show(p)
Make sure to use a ColumnDataSource created from this dataframe and use it in your plot. Then you need to have a way to update the CDS in your app when data is updated. Hope this helps.