☰Read-only archive⌕
Looking for help with Bokeh?

This is a read-only archive. Ask questions and join the conversation on GitHub.

Visit Community Support on GitHub →
Archived discussions · Captured October 28, 2026

When adding secondary vertical axes, the range of primary axes is too wide

Community Supportbokehjs
yuji38kwmt
yuji38kwmt

What would i like to do?

I would like to create line chart with having multiple axes.
I referred to the following site.

https://docs.bokeh.org/en/latest/docs/user_guide/plotting.html#twin-axes

I executed the following code.

from bokeh.models import DataRange1d, LinearAxis
from bokeh.plotting import figure, output_file, save

output_file("graph.html")

x = [0, 1, 2]
y1 = [0, 1, 2]
y2 = [0, 1, 100]

fig = figure(x_axis_label="x", y_axis_label="y1")

y_range_name = "secondary_axis"

fig.extra_y_ranges = {y_range_name: DataRange1d(end=max(y2) * 1.05)}
fig.line(x=x, y=y1, legend_label="y1", color="blue")
fig.line(
    x=x,
    y=y2,
    legend_label="y2",
    color="red",
    y_range_name=y_range_name,
)

fig.add_layout(
    LinearAxis(
        y_range_name=y_range_name,
        axis_label="y2",
    ),
    "right",
)

save(fig)
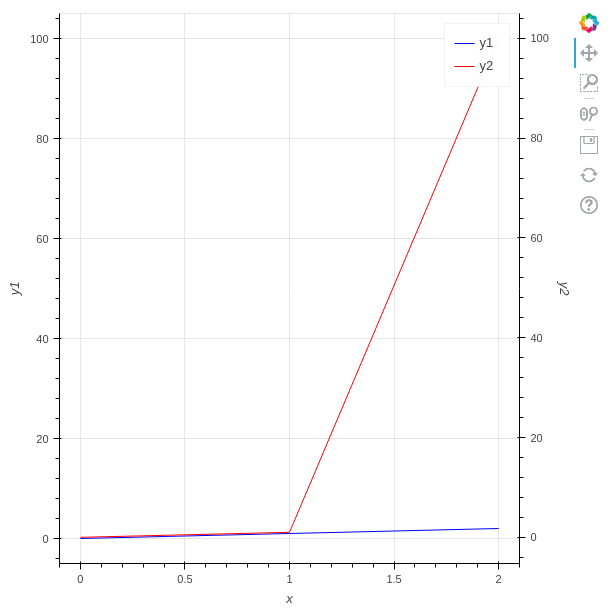
Maximum value of y1 is 2, but range y1 axes is 0 to 100. The range is too wide !

Why is this happening?
And what should I do to make range y1 axes narrow.

Additional

When swapping y1 for y2, range y1 axes is narrow.

y1 = [0, 1, 100]
y2 = [0, 1, 2]

Environmental

  • Python3.10.2
  • bokeh 2.4.3

p.s.

I asked Japanese Stackoverflow, but no one answers.

⌁   Link to post
yuji38kwmt
yuji38kwmt

Thanks!

I was able to do what I wanted to do with the following code.

from bokeh.models import DataRange1d, LinearAxis
from bokeh.plotting import figure, output_file, save

output_file("graph.html")

x = [0, 1, 2]
y1 = [0, 1, 2]
y2 = [0, 1, 100]

fig = figure(x_axis_label="x", y_axis_label="y1")

y_range_name = "secondary_axis"

y1_line = fig.line(x=x, y=y1, legend_label="y1", color="blue")
y2_line = fig.line(
    x=x,
    y=y2,
    legend_label="y2",
    color="red",
    y_range_name=y_range_name,
)

fig.extra_y_ranges = {y_range_name: DataRange1d(renderers=[y2_line])}

fig.y_range.renderers = [y1_line]
fig.add_layout(
    LinearAxis(
        y_range_name=y_range_name,
        axis_label="y2",
    ),
    "right",
)

save(fig)

⌁   Link to post
Bryan
Bryan

Hopefully with a little consideration, it’s evident why this is not really a trivial thing. Normally we always want axes to have “nice” ticks, and Bokeh’s tickers always try to select “nice” tick values. But in general, there is no possible way to assume that a “nice” tick on one axis will correspond to a “nice” tick on the other axis. It depends entirely on the different range starts and ends and Bokeh has no control over that, only you do. So the best that can be done is let you tell Bokeh what you want when it can’t figure out for itself.

But you don’t have to give up. Setting fixed ticks, in case you want to experiment with that, is pretty trivial: https://docs.bokeh.org/en/latest/docs/user_guide/styling.html#tick-locations. It’s probably a workable approach especially if you don’t need to support pan/zoom.

⌁   Link to post

End of archived discussion · Replies are disabled