
Hi
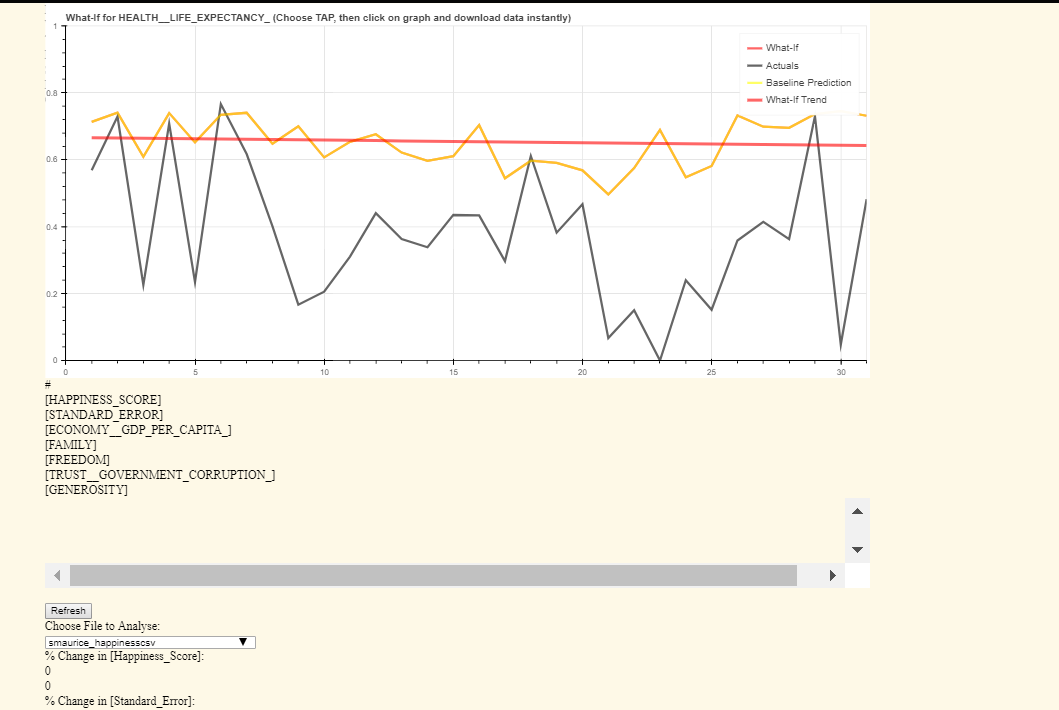
does any one know why Bokeh is not properly creating these widgets? There is no error in the bokeh server and NGINX is also not showing any issues. Any help would be appreciated.
···
Sebastian Maurice, PhD
Mobile: 403-612-5443
 Read-only archive⌕
Hi
does any one know why Bokeh is not properly creating these widgets? There is no error in the bokeh server and NGINX is also not showing any issues. Any help would be appreciated.
Sebastian Maurice, PhD
Mobile: 403-612-5443

Hi,
Looks like a CSS problem, would need more information about what exactly you are doing (example code, etc) to really be able to say anything more than that.
Thanks,
Bryan
On Oct 26, 2017, at 09:38, Sebastian Maurice <sebastian.maurice@gmail.com> wrote:
Hi
does any one know why Bokeh is not properly creating these widgets? There is no error in the bokeh server and NGINX is also not showing any issues. Any help would be appreciated.
<image.png>
--
-----
Sebastian Maurice, PhD
Mobile: 403-612-5443--
You received this message because you are subscribed to the Google Groups "Bokeh Discussion - Public" group.
To unsubscribe from this group and stop receiving emails from it, send an email to bokeh+unsubscribe@continuum.io.
To post to this group, send email to bokeh@continuum.io.
To view this discussion on the web visit https://groups.google.com/a/continuum.io/d/msgid/bokeh/CADZk7rEWN4RNn5Q4UvHBjkNp8Fwb2VRnEx7on4i-0D2GG-CX%3Dw%40mail.gmail.com\.
For more options, visit https://groups.google.com/a/continuum.io/d/optout\.
Attaching the code snippet:
import numpy as np
import pyodbc as pyodbc
import imp
import datetime
import os
import joblib
import scipy.stats
import numbers
import bokeh
from bokeh.io import curdoc
from bokeh.layouts import row, widgetbox, column,layout
from bokeh.models import ColumnDataSource,HoverTool,OpenURL, TapTool
from bokeh.models.widgets import DataTable, DateFormatter, TableColumn
from bokeh.models.widgets import Slider, TextInput,Button
from bokeh.plotting import figure
from bokeh.models.widgets import Select
import statsmodels.api as sm
from statsmodels.tsa.arima_model import ARIMAResults
def setup():
global myobjs
global myobjchanges
global mytextobjs
global source2
global depvar
global smean
global sstd
global kurtosis
global skewness
global select
global refresh
global fieldnames
global objs
global textobjs
global pointtextobjs
global pointpred
global objcnt
global mypointtextobjs
global oldpk
global mainlayout
global mainrow
global mainrow2
global inputs
global data_table
global ispkout
global outpk
if objcnt>0:
smean=TextInput()
sstd=TextInput()
kurtosis=TextInput()
skewness=TextInput()
select = Select()
refresh=Button()
myobjs=list()
myobjchanges=list()
mytextobjs=list()
objs =
textobjs =
pointtextobjs=
pointpred= TextInput()
#fieldnames=
mypointtextobjs=list()
objcnt+=1
else:
objcnt+=1
refresh = Button(label=“Refresh”, button_type=“success”)
if ispkout:
select = Select(name=‘mainlist’,title=“Choose File to Analyse:”, value=outpk, options=pklist)
else:
select = Select(name=‘mainlist’,title=“Choose File to Analyse:”, value=pk, options=pklist)
objs = [Slider() for i in range(len(fieldnames))]
textobjs = [TextInput() for i in range(len(fieldnames))]
pointtextobjs= [TextInput() for i in range(len(fieldnames))]
pointpred= TextInput()
myobjs.append(refresh)
myobjs.append(select)
#myobjchanges.append(select)
for obj,thename in zip(objs,fieldnames):
obj.title=‘%% Change in %s’ % (thename)
obj.value=0
obj.start=-100
obj.end=100
obj.step=5
myobjs.append(obj)
myobjchanges.append(obj)
for thename,pobjs in zip(fieldnames,pointtextobjs):
pobjs.title=‘Point Value of %s’ % (thename)
pobjs.value=‘’
myobjs.append(pobjs)
mypointtextobjs.append(pobjs)
pointpred.title=‘Point Prediction For %s’ % (depvar)
pointpred.value=‘’
myobjs.append(pointpred)
#mypointtextobjs.append(pointpred)
for thename,tobjs in zip(fieldnames,textobjs):
tobjs.title=‘Mean of %s’ % (thename)
tobjs.value=‘’
myobjs.append(tobjs)
mytextobjs.append(tobjs)
#mytextobjs=list()
meantit=“Predicted Mean (%s)” % (depvar)
stdtit=“Predicted Standard Deviation (%s)” % (depvar)
skurt=“Predicted Kurtosis (%s)” % (depvar)
sskew=“Predicted Skewness (%s)” % (depvar)
smean=TextInput(title=meantit, value=‘’)
sstd=TextInput(title=stdtit, value=‘’)
kurtosis=TextInput(title=skurt, value=‘’)
skewness=TextInput(title=sskew, value=‘’)
myobjs.append(smean)
myobjs.append(sstd)
myobjs.append(kurtosis)
myobjs.append(skewness)
#myobjchanges.append(mean)
#myobjchanges.append(sstd)
#myobjchanges.append(kurtosis)
#myobjchanges.append(skewness)
#objs[0].do_sth()
##print(myobj[0].value)
##print(myobj[1].value)
##print(myobj[2].value)
dicts = {}
tableobjdata=list()
fmeans=list()
for i,keys in zip(range(len(fieldnames)),fieldnames):
r=[round(row[i],3) for row in testvars]
dicts[keys] = r
#tableobjdata.append(val)
##print(tableobjdata)
data2 = dicts
##print(dicts)
source2 = ColumnDataSource(data2)
tableobjcols=list()
tabobjs = [TableColumn() for i in range(len(fieldnames))]
for obj,thename in zip(tabobjs,fieldnames):
obj.field=thename
obj.title=thename.upper()
tableobjcols.append(obj)
columns =tableobjcols
data_table = DataTable(source=source2, columns=columns, width=1100, height=280)
for w in myobjchanges:
w.on_change(‘value’, update_data)
for wt in mypointtextobjs:
wt.on_change(‘value’, update_point)
select.on_change(‘value’, update_select)
refresh.on_click(refreshhandler)
###################### OPEN URL
url = “http://www.analytix.ai/stocks/otics/bokeh/whatiffiles/%s.csv” % (pk)
taptool = plot.select(type=TapTool)
taptool.callback = OpenURL(url=url)
#inputs = column(myobjs)
inputs = widgetbox(myobjs)
mainrow=column(plot,data_table)
mainrow2=row(mainrow,inputs)
if objcnt-1==0:
mainlayout=column(mainrow2)
curdoc().add_root(mainlayout)
else:
mainlayout.children[0]=column(mainrow2)
curdoc().title = “OTICS ENGINE”
setup()
On Thu, Oct 26, 2017 at 11:07 AM, Bryan Van de ven bryan@bokeh.org wrote:
Hi,
Looks like a CSS problem, would need more information about what exactly you are doing (example code, etc) to really be able to say anything more than that.
Thanks,
Bryan
On Oct 26, 2017, at 09:38, Sebastian Maurice sebastian.maurice@gmail.com wrote:
Hi
does any one know why Bokeh is not properly creating these widgets? There is no error in the bokeh server and NGINX is also not showing any issues. Any help would be appreciated.
<image.png>
–
Sebastian Maurice, PhD
Mobile: 403-612-5443
–
You received this message because you are subscribed to the Google Groups “Bokeh Discussion - Public” group.
To unsubscribe from this group and stop receiving emails from it, send an email to bokeh+unsubscribe@continuum.io.
To post to this group, send email to bokeh@continuum.io.
To view this discussion on the web visit https://groups.google.com/a/continuum.io/d/msgid/bokeh/CADZk7rEWN4RNn5Q4UvHBjkNp8Fwb2VRnEx7on4i-0D2GG-CX%3Dw%40mail.gmail.com.
For more options, visit https://groups.google.com/a/continuum.io/d/optout.
–
You received this message because you are subscribed to the Google Groups “Bokeh Discussion - Public” group.
To unsubscribe from this group and stop receiving emails from it, send an email to bokeh+unsubscribe@continuum.io.
To post to this group, send email to bokeh@continuum.io.
To view this discussion on the web visit https://groups.google.com/a/continuum.io/d/msgid/bokeh/290EBE59-BA4B-44CF-BC59-E24CD3C52DAA%40anaconda.com.
For more options, visit https://groups.google.com/a/continuum.io/d/optout.
–
Sebastian Maurice, PhD
Mobile: 403-612-5443
Hi, is it possible to “manually” specify the static path to the CSS and JS when running bokeh serve?
On Thu, Oct 26, 2017 at 11:15 AM, Sebastian Maurice sebastian.maurice@gmail.com wrote:
Attaching the code snippet:
import numpy as np
import pyodbc as pyodbc
import imp
import datetime
import os
import joblib
import scipy.stats
import numbers
import bokeh
from bokeh.io import curdoc
from bokeh.layouts import row, widgetbox, column,layout
from bokeh.models import ColumnDataSource,HoverTool,OpenURL, TapTool
from bokeh.models.widgets import DataTable, DateFormatter, TableColumn
from bokeh.models.widgets import Slider, TextInput,Button
from bokeh.plotting import figure
from bokeh.models.widgets import Select
import statsmodels.api as sm
from statsmodels.tsa.arima_model import ARIMAResults
SETUP SLIDERS
def setup():
global myobjs
global myobjchanges
global mytextobjs
global source2
global depvar
global smean
global sstd
global kurtosis
global skewness
global select
global refresh
global fieldnames
global objs
global textobjs
global pointtextobjs
global pointpred
global objcnt
global mypointtextobjs
global oldpk
global mainlayout
global mainrow
global mainrow2
global inputs
global data_table
global ispkout
global outpk
if objcnt>0:
smean=TextInput()
sstd=TextInput()
kurtosis=TextInput()
skewness=TextInput()
select = Select()
refresh=Button()
myobjs=list()
myobjchanges=list()
mytextobjs=list()
objs =
textobjs =
pointtextobjs=
pointpred= TextInput()
#fieldnames=
mypointtextobjs=list()
objcnt+=1
else:
objcnt+=1
refresh = Button(label=“Refresh”, button_type=“success”)
if ispkout:
select = Select(name=‘mainlist’,title=“Choose File to Analyse:”, value=outpk, options=pklist)
else:
select = Select(name=‘mainlist’,title=“Choose File to Analyse:”, value=pk, options=pklist)
objs = [Slider() for i in range(len(fieldnames))]
textobjs = [TextInput() for i in range(len(fieldnames))]
pointtextobjs= [TextInput() for i in range(len(fieldnames))]
pointpred= TextInput()
myobjs.append(refresh)
myobjs.append(select)
#myobjchanges.append(select)
for obj,thename in zip(objs,fieldnames):
obj.title=‘%% Change in %s’ % (thename)
obj.value=0
obj.start=-100
obj.end=100
obj.step=5
myobjs.append(obj)
myobjchanges.append(obj)
for thename,pobjs in zip(fieldnames,pointtextobjs):
pobjs.title=‘Point Value of %s’ % (thename)
pobjs.value=‘’
myobjs.append(pobjs)
mypointtextobjs.append(pobjs)
pointpred.title=‘Point Prediction For %s’ % (depvar)
pointpred.value=‘’
myobjs.append(pointpred)
#mypointtextobjs.append(pointpred)
for thename,tobjs in zip(fieldnames,textobjs):
tobjs.title=‘Mean of %s’ % (thename)
tobjs.value=‘’
myobjs.append(tobjs)
mytextobjs.append(tobjs)
#mytextobjs=list()
meantit=“Predicted Mean (%s)” % (depvar)
stdtit=“Predicted Standard Deviation (%s)” % (depvar)
skurt=“Predicted Kurtosis (%s)” % (depvar)
sskew=“Predicted Skewness (%s)” % (depvar)
smean=TextInput(title=meantit, value=‘’)
sstd=TextInput(title=stdtit, value=‘’)
kurtosis=TextInput(title=skurt, value=‘’)
skewness=TextInput(title=sskew, value=‘’)
myobjs.append(smean)
myobjs.append(sstd)
myobjs.append(kurtosis)
myobjs.append(skewness)
#myobjchanges.append(mean)
#myobjchanges.append(sstd)
#myobjchanges.append(kurtosis)
#myobjchanges.append(skewness)
#objs[0].do_sth()
##print(myobj[0].value)
##print(myobj[1].value)
##print(myobj[2].value)
Set up widgets
SETUP TABLE - CREATE DICTS
dicts = {}
tableobjdata=list()
fmeans=list()
for i,keys in zip(range(len(fieldnames)),fieldnames):
r=[round(row[i],3) for row in testvars]
dicts[keys] = r
#tableobjdata.append(val)
##print(tableobjdata)
data2 = dicts
##print(dicts)
source2 = ColumnDataSource(data2)
tableobjcols=list()
tabobjs = [TableColumn() for i in range(len(fieldnames))]
for obj,thename in zip(tabobjs,fieldnames):
obj.field=thename
obj.title=thename.upper()
tableobjcols.append(obj)
columns =tableobjcols
data_table = DataTable(source=source2, columns=columns, width=1100, height=280)
for w in myobjchanges:
w.on_change(‘value’, update_data)
for wt in mypointtextobjs:
wt.on_change(‘value’, update_point)
select.on_change(‘value’, update_select)
refresh.on_click(refreshhandler)
###################### OPEN URL
url = “http://www.analytix.ai/stocks/otics/bokeh/whatiffiles/%s.csv” % (pk)
taptool = plot.select(type=TapTool)
taptool.callback = OpenURL(url=url)
Set up layouts and add to document
#inputs = column(myobjs)
inputs = widgetbox(myobjs)
mainrow=column(plot,data_table)
mainrow2=row(mainrow,inputs)
if objcnt-1==0:
mainlayout=column(mainrow2)
curdoc().add_root(mainlayout)
else:
mainlayout.children[0]=column(mainrow2)
curdoc().title = “OTICS ENGINE”
setup()
–
On Thu, Oct 26, 2017 at 11:07 AM, Bryan Van de ven bryanv@anaconda.com wrote:
Hi,
Looks like a CSS problem, would need more information about what exactly you are doing (example code, etc) to really be able to say anything more than that.
Thanks,
Bryan
On Oct 26, 2017, at 09:38, Sebastian Maurice sebastian.maurice@gmail.com wrote:
Hi
does any one know why Bokeh is not properly creating these widgets? There is no error in the bokeh server and NGINX is also not showing any issues. Any help would be appreciated.
<image.png>
–
Sebastian Maurice, PhD
Mobile: 403-612-5443
–
You received this message because you are subscribed to the Google Groups “Bokeh Discussion - Public” group.
To unsubscribe from this group and stop receiving emails from it, send an email to bokeh+unsubscribe@continuum.io.
To post to this group, send email to bokeh@continuum.io.
To view this discussion on the web visit https://groups.google.com/a/continuum.io/d/msgid/bokeh/CADZk7rEWN4RNn5Q4UvHBjkNp8Fwb2VRnEx7on4i-0D2GG-CX%3Dw%40mail.gmail.com.
For more options, visit https://groups.google.com/a/continuum.io/d/optout.
–
You received this message because you are subscribed to the Google Groups “Bokeh Discussion - Public” group.
To unsubscribe from this group and stop receiving emails from it, send an email to bokeh+unsubscribe@continuum.io.
To post to this group, send email to bokeh@continuum.io.
To view this discussion on the web visit https://groups.google.com/a/continuum.io/d/msgid/bokeh/290EBE59-BA4B-44CF-BC59-E24CD3C52DAA%40anaconda.com.
For more options, visit https://groups.google.com/a/continuum.io/d/optout.
Sebastian Maurice, PhD
Mobile: 403-612-5443
Sebastian Maurice, PhD
Mobile: 403-612-5443
I have solved this problem…good ol’ NGINX was preventing the proper exchange of CSS/JS.
thanks
Sebastian
On Thu, Oct 26, 2017 at 11:15 AM, Sebastian Maurice sebastian.maurice@gmail.com wrote:
Attaching the code snippet:
import numpy as np
import pyodbc as pyodbc
import imp
import datetime
import os
import joblib
import scipy.stats
import numbers
import bokeh
from bokeh.io import curdoc
from bokeh.layouts import row, widgetbox, column,layout
from bokeh.models import ColumnDataSource,HoverTool,OpenURL, TapTool
from bokeh.models.widgets import DataTable, DateFormatter, TableColumn
from bokeh.models.widgets import Slider, TextInput,Button
from bokeh.plotting import figure
from bokeh.models.widgets import Select
import statsmodels.api as sm
from statsmodels.tsa.arima_model import ARIMAResults
SETUP SLIDERS
def setup():
global myobjs
global myobjchanges
global mytextobjs
global source2
global depvar
global smean
global sstd
global kurtosis
global skewness
global select
global refresh
global fieldnames
global objs
global textobjs
global pointtextobjs
global pointpred
global objcnt
global mypointtextobjs
global oldpk
global mainlayout
global mainrow
global mainrow2
global inputs
global data_table
global ispkout
global outpk
if objcnt>0:
smean=TextInput()
sstd=TextInput()
kurtosis=TextInput()
skewness=TextInput()
select = Select()
refresh=Button()
myobjs=list()
myobjchanges=list()
mytextobjs=list()
objs =
textobjs =
pointtextobjs=
pointpred= TextInput()
#fieldnames=
mypointtextobjs=list()
objcnt+=1
else:
objcnt+=1
refresh = Button(label=“Refresh”, button_type=“success”)
if ispkout:
select = Select(name=‘mainlist’,title=“Choose File to Analyse:”, value=outpk, options=pklist)
else:
select = Select(name=‘mainlist’,title=“Choose File to Analyse:”, value=pk, options=pklist)
objs = [Slider() for i in range(len(fieldnames))]
textobjs = [TextInput() for i in range(len(fieldnames))]
pointtextobjs= [TextInput() for i in range(len(fieldnames))]
pointpred= TextInput()
myobjs.append(refresh)
myobjs.append(select)
#myobjchanges.append(select)
for obj,thename in zip(objs,fieldnames):
obj.title=‘%% Change in %s’ % (thename)
obj.value=0
obj.start=-100
obj.end=100
obj.step=5
myobjs.append(obj)
myobjchanges.append(obj)
for thename,pobjs in zip(fieldnames,pointtextobjs):
pobjs.title=‘Point Value of %s’ % (thename)
pobjs.value=‘’
myobjs.append(pobjs)
mypointtextobjs.append(pobjs)
pointpred.title=‘Point Prediction For %s’ % (depvar)
pointpred.value=‘’
myobjs.append(pointpred)
#mypointtextobjs.append(pointpred)
for thename,tobjs in zip(fieldnames,textobjs):
tobjs.title=‘Mean of %s’ % (thename)
tobjs.value=‘’
myobjs.append(tobjs)
mytextobjs.append(tobjs)
#mytextobjs=list()
meantit=“Predicted Mean (%s)” % (depvar)
stdtit=“Predicted Standard Deviation (%s)” % (depvar)
skurt=“Predicted Kurtosis (%s)” % (depvar)
sskew=“Predicted Skewness (%s)” % (depvar)
smean=TextInput(title=meantit, value=‘’)
sstd=TextInput(title=stdtit, value=‘’)
kurtosis=TextInput(title=skurt, value=‘’)
skewness=TextInput(title=sskew, value=‘’)
myobjs.append(smean)
myobjs.append(sstd)
myobjs.append(kurtosis)
myobjs.append(skewness)
#myobjchanges.append(mean)
#myobjchanges.append(sstd)
#myobjchanges.append(kurtosis)
#myobjchanges.append(skewness)
#objs[0].do_sth()
##print(myobj[0].value)
##print(myobj[1].value)
##print(myobj[2].value)
Set up widgets
SETUP TABLE - CREATE DICTS
dicts = {}
tableobjdata=list()
fmeans=list()
for i,keys in zip(range(len(fieldnames)),fieldnames):
r=[round(row[i],3) for row in testvars]
dicts[keys] = r
#tableobjdata.append(val)
##print(tableobjdata)
data2 = dicts
##print(dicts)
source2 = ColumnDataSource(data2)
tableobjcols=list()
tabobjs = [TableColumn() for i in range(len(fieldnames))]
for obj,thename in zip(tabobjs,fieldnames):
obj.field=thename
obj.title=thename.upper()
tableobjcols.append(obj)
columns =tableobjcols
data_table = DataTable(source=source2, columns=columns, width=1100, height=280)
for w in myobjchanges:
w.on_change(‘value’, update_data)
for wt in mypointtextobjs:
wt.on_change(‘value’, update_point)
select.on_change(‘value’, update_select)
refresh.on_click(refreshhandler)
###################### OPEN URL
url = “http://www.analytix.ai/stocks/otics/bokeh/whatiffiles/%s.csv” % (pk)
taptool = plot.select(type=TapTool)
taptool.callback = OpenURL(url=url)
Set up layouts and add to document
#inputs = column(myobjs)
inputs = widgetbox(myobjs)
mainrow=column(plot,data_table)
mainrow2=row(mainrow,inputs)
if objcnt-1==0:
mainlayout=column(mainrow2)
curdoc().add_root(mainlayout)
else:
mainlayout.children[0]=column(mainrow2)
curdoc().title = “OTICS ENGINE”
setup()
–
On Thu, Oct 26, 2017 at 11:07 AM, Bryan Van de ven bryan@bokeh.org wrote:
Hi,
Looks like a CSS problem, would need more information about what exactly you are doing (example code, etc) to really be able to say anything more than that.
Thanks,
Bryan
On Oct 26, 2017, at 09:38, Sebastian Maurice sebastian.maurice@gmail.com wrote:
Hi
does any one know why Bokeh is not properly creating these widgets? There is no error in the bokeh server and NGINX is also not showing any issues. Any help would be appreciated.
<image.png>
–
Sebastian Maurice, PhD
Mobile: 403-612-5443
–
You received this message because you are subscribed to the Google Groups “Bokeh Discussion - Public” group.
To unsubscribe from this group and stop receiving emails from it, send an email to bokeh+unsubscribe@continuum.io.
To post to this group, send email to bokeh@continuum.io.
To view this discussion on the web visit https://groups.google.com/a/continuum.io/d/msgid/bokeh/CADZk7rEWN4RNn5Q4UvHBjkNp8Fwb2VRnEx7on4i-0D2GG-CX%3Dw%40mail.gmail.com.
For more options, visit https://groups.google.com/a/continuum.io/d/optout.
–
You received this message because you are subscribed to the Google Groups “Bokeh Discussion - Public” group.
To unsubscribe from this group and stop receiving emails from it, send an email to bokeh+unsubscribe@continuum.io.
To post to this group, send email to bokeh@continuum.io.
To view this discussion on the web visit https://groups.google.com/a/continuum.io/d/msgid/bokeh/290EBE59-BA4B-44CF-BC59-E24CD3C52DAA%40anaconda.com.
For more options, visit https://groups.google.com/a/continuum.io/d/optout.
Sebastian Maurice, PhD
Mobile: 403-612-5443
Sebastian Maurice, PhD
Mobile: 403-612-5443

End of archived discussion · Replies are disabled