Looking at the cross filter example see the following nice visualization of a table:
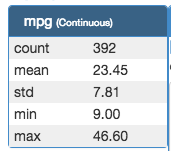
Given a Pandas Series or DataFrame, what widget / object can I use to display/render it in Bokeh?
Thanks,
Josh
Looking at the cross filter example see the following nice visualization of a table:
Given a Pandas Series or DataFrame, what widget / object can I use to display/render it in Bokeh?
Thanks,
Josh
Hi,
On Thu, Feb 26, 2015 at 8:26 PM, Josh Wasserstein [email protected] wrote:
Looking at the cross filter example see the following nice visualization of a table:
Given a Pandas Series or DataFrame, what widget / object can I use to display/render it in Bokeh?
crossfilter uses some custom HTML/JS, so this will be hard to use on its own. However, there is a dedicated DataTable widget to visualise a ColumnDataSource (so also a DataFrame), see [1] (unfortunately we don’t have a live demo of this particular example).
[1] https://github.com/bokeh/bokeh/blob/master/examples/glyphs/data_tables.py
Mateusz
Thanks,
Josh
–
You received this message because you are subscribed to the Google Groups “Bokeh Discussion - Public” group.
To unsubscribe from this group and stop receiving emails from it, send an email to [email protected].
To post to this group, send email to [email protected].
To view this discussion on the web visit https://groups.google.com/a/continuum.io/d/msgid/bokeh/CAD4ivxVX53bVH6-ZgNysrfGvde%3DEG-E1rdsL4XZLAcA7ws2g3A%40mail.gmail.com.
For more options, visit https://groups.google.com/a/continuum.io/d/optout.
Fantastic. Thank you Mateasuz.
Josh
On Thu, Feb 26, 2015 at 4:25 PM, Mateusz Paprocki [email protected] wrote:
Hi,
–
You received this message because you are subscribed to the Google Groups “Bokeh Discussion - Public” group.
To unsubscribe from this group and stop receiving emails from it, send an email to [email protected].
To post to this group, send email to [email protected].
To view this discussion on the web visit https://groups.google.com/a/continuum.io/d/msgid/bokeh/CANFzp8gsn68KSj-gVCXiiJ2h_sgjspaypuQPS1p-2rThK6knGw%40mail.gmail.com.
For more options, visit https://groups.google.com/a/continuum.io/d/optout.
On Thu, Feb 26, 2015 at 8:26 PM, Josh Wasserstein [email protected] wrote:
Looking at the cross filter example see the following nice visualization of a table:
Given a Pandas Series or DataFrame, what widget / object can I use to display/render it in Bokeh?
crossfilter uses some custom HTML/JS, so this will be hard to use on its own. However, there is a dedicated DataTable widget to visualise a ColumnDataSource (so also a DataFrame), see [1] (unfortunately we don’t have a live demo of this particular example).
[1] https://github.com/bokeh/bokeh/blob/master/examples/glyphs/data_tables.py
Mateusz
Thanks,
Josh
–
You received this message because you are subscribed to the Google Groups “Bokeh Discussion - Public” group.
To unsubscribe from this group and stop receiving emails from it, send an email to [email protected].
To post to this group, send email to [email protected].
To view this discussion on the web visit https://groups.google.com/a/continuum.io/d/msgid/bokeh/CAD4ivxVX53bVH6-ZgNysrfGvde%3DEG-E1rdsL4XZLAcA7ws2g3A%40mail.gmail.com.
For more options, visit https://groups.google.com/a/continuum.io/d/optout.