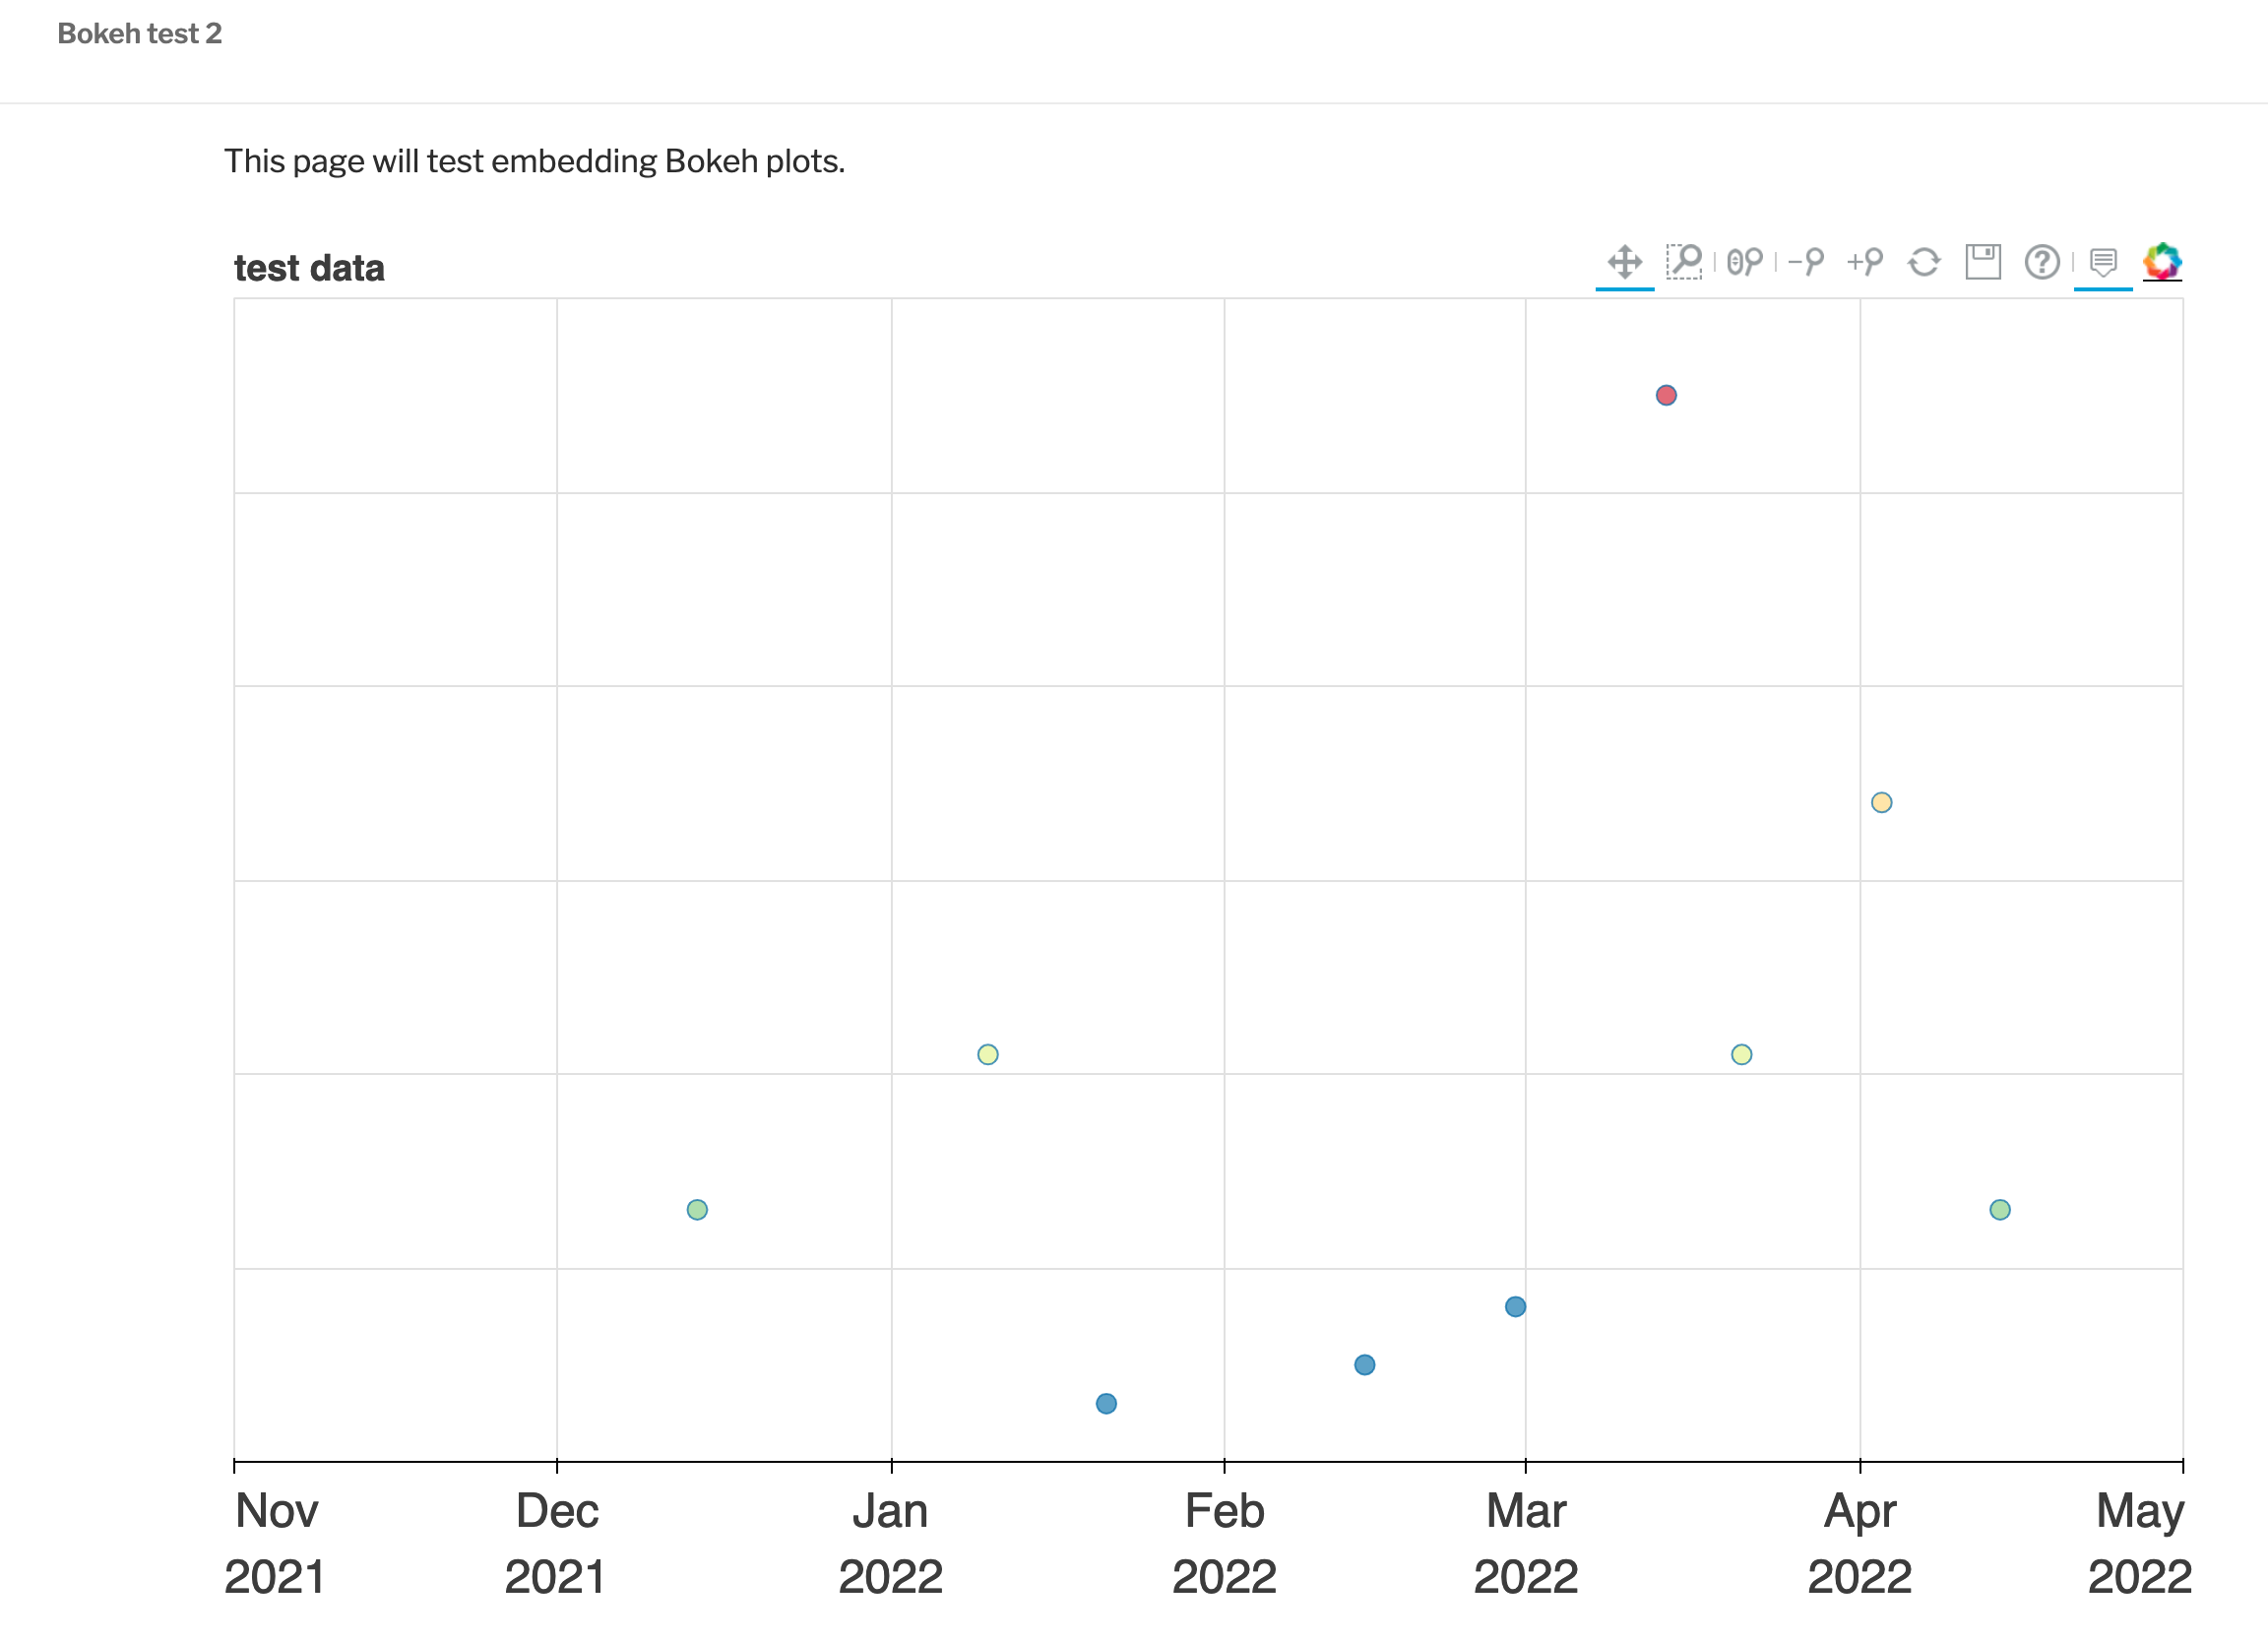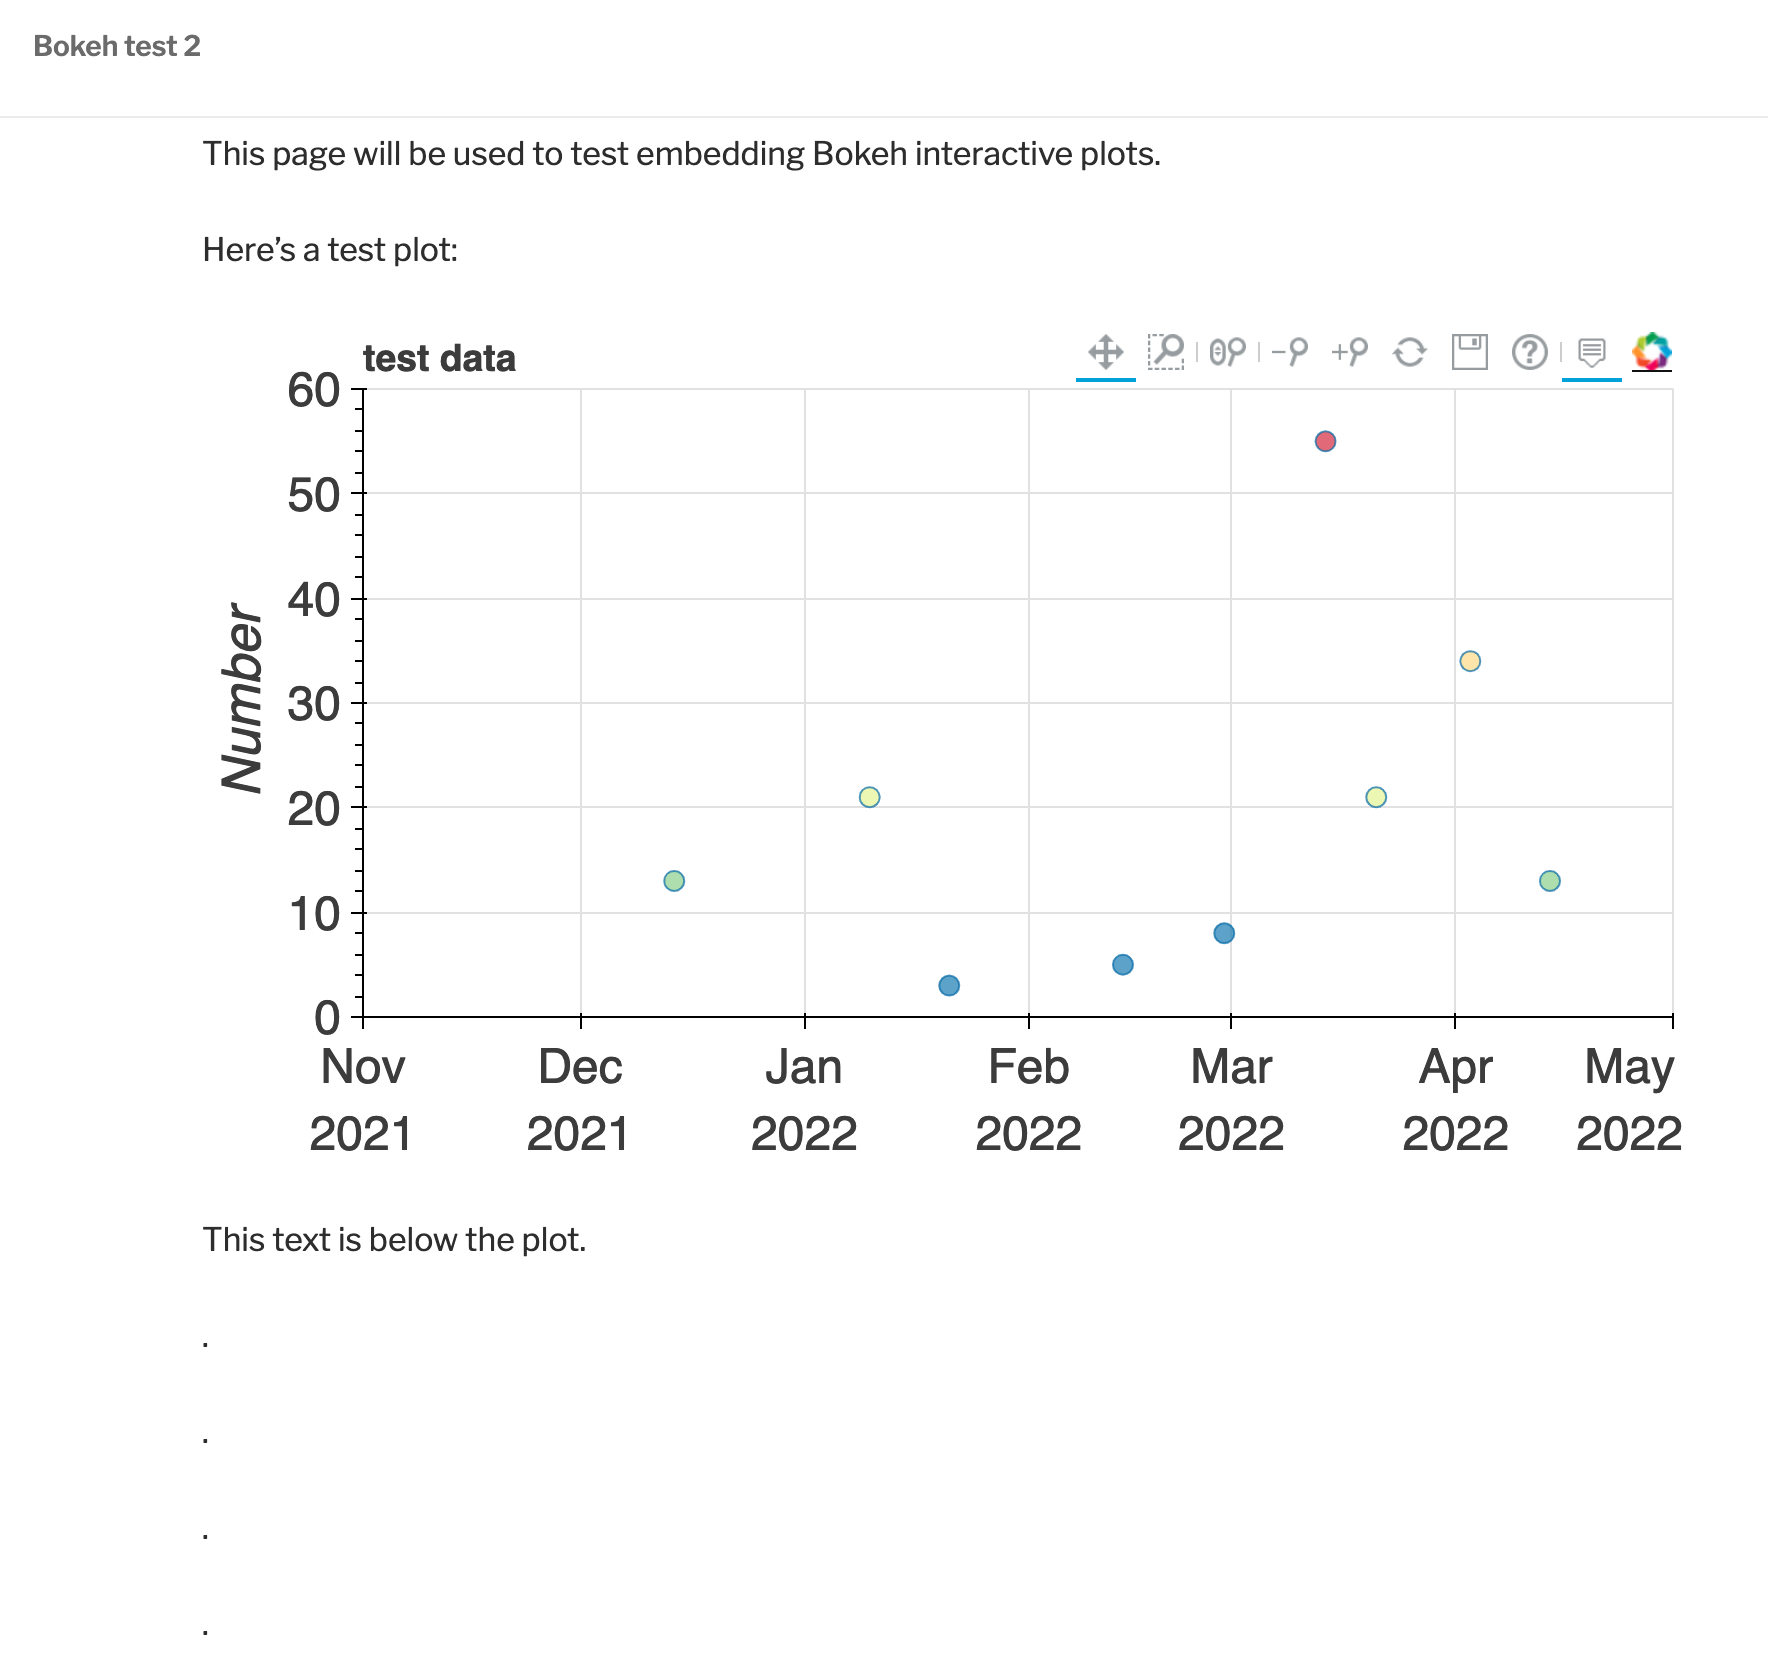
I’m trying to embed a Bokeh plot into a Wordpress site (not blog, full site). The code output by Bokeh is opened into a browser and looks great. However… when I put that same code into a Wordpress webpage, the size of the plot is very different: i.e., the height is very small, making the plot hard to use. The width initially was also far too long for the page; I changed the plot width in the code and fixed that issue. I expected changing the height would also adjust what I see in the webpage, but it does not.
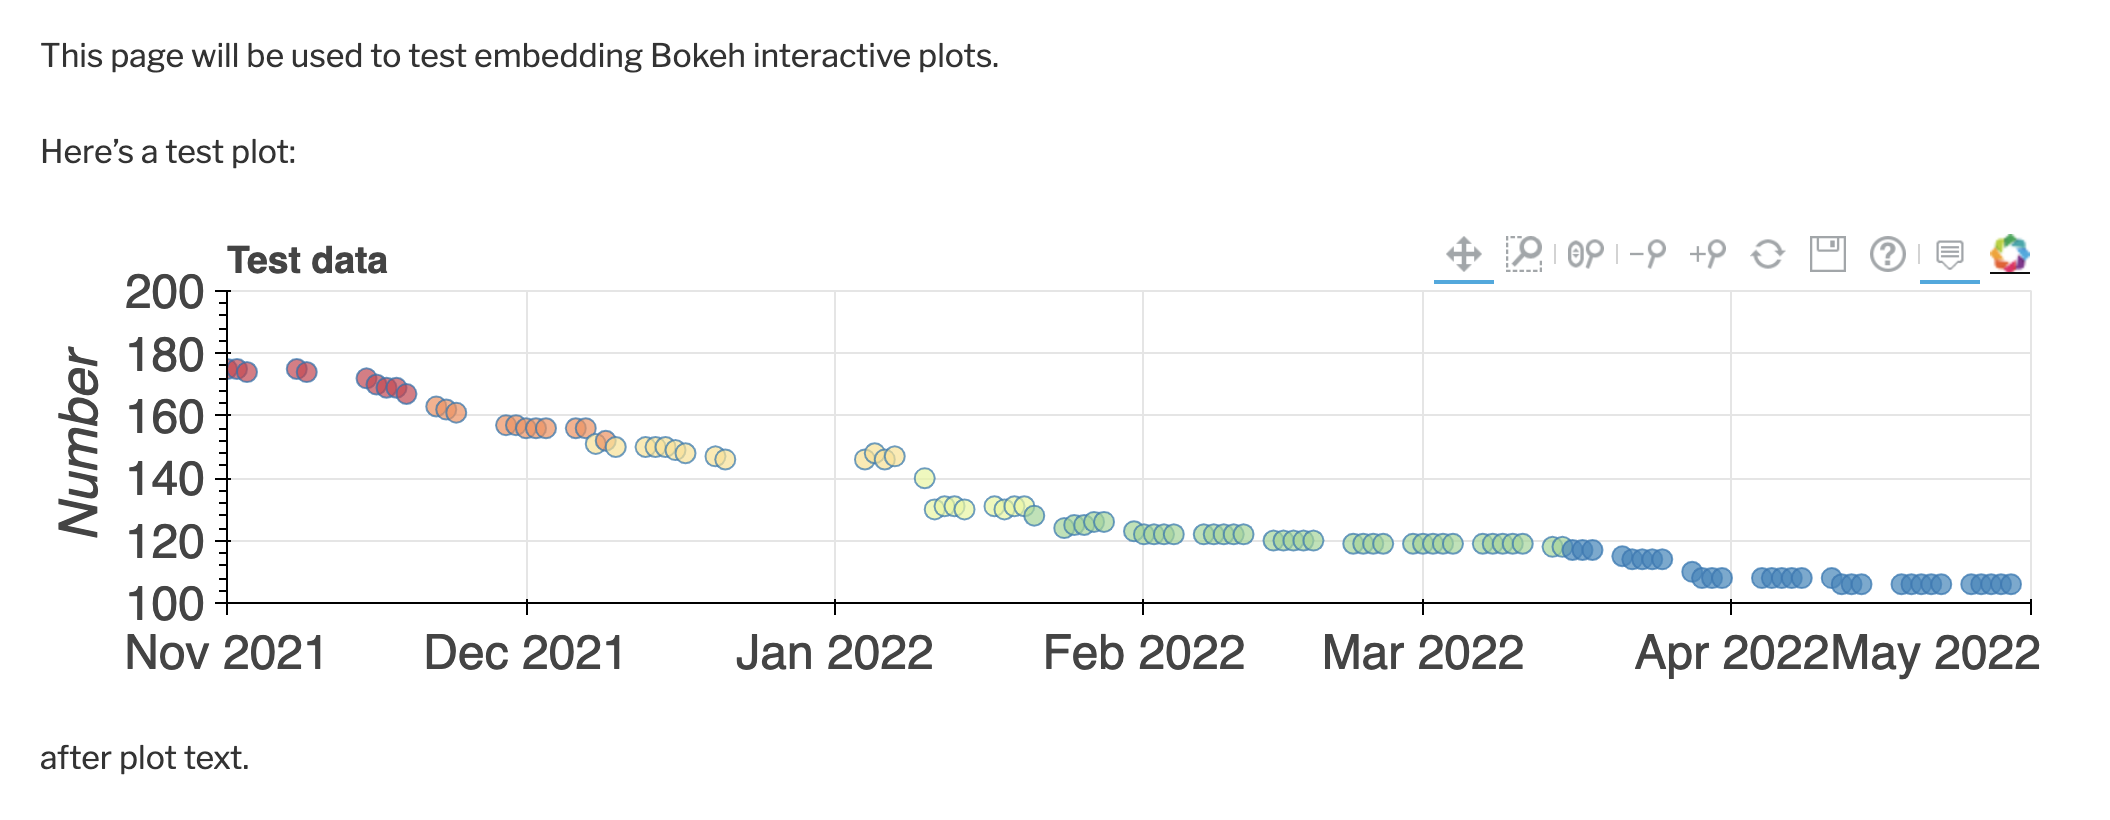
Here’s a screenshot of the result of the original code:
I’ve created a simpler version of the code to share here that results in the same issue:
# import needed packages ------------------------------------------------------

import pandas as pd
import datetime as dt

# Bokeh libraries
from bokeh.plotting  import figure, show
from bokeh.palettes  import Spectral6
from bokeh.transform import linear_cmap
from bokeh.models    import ColumnDataSource, ColorBar, DatetimeTickFormatter, Label
from bokeh.models    import HoverTool, ResetTool, SaveTool
from bokeh.io        import output_file

# options ---------------------------------------------------------------------

year = 2022

output_file('test_data.html', title = 'test Bokeh')

# get data --------------------------------------------------------------------

data           = pd.DataFrame()
data['N']      = [13,1,21,3,5,8,55,21,34,13]
data['date']   = [dt.datetime(2021,12,14),
                  dt.datetime(2022,12,28),
                  dt.datetime(2022,1,10),
                  dt.datetime(2022,1,21),
                  dt.datetime(2022,2,14),
                  dt.datetime(2022,2,28),
                  dt.datetime(2022,3,14),
                  dt.datetime(2022,3,21),
                  dt.datetime(2022,4,3),
                  dt.datetime(2022,4,14)]

x = pd.to_datetime(data['date'], format = '%Y-%m-%d')
y = data['N']

# set up limits ---------------------------------------------------------------

N_max = max(data['N'])

# create x-axis limits
start_date = pd.to_datetime(dt.date(year-1,11,1), format = '%Y-%m-%d')
end_date   = pd.to_datetime(dt.date(year,5,1),   format = '%Y-%m-%d')

N_final = y.values[-1]
y_max = 60
y_min = 0

# plot ------------------------------------------------------------------------

mapper = linear_cmap(field_name='y', palette=Spectral6 ,low=min(y) ,high=max(y))

# Create a figure with no toolbar and axis ranges of [0,3]
fig = figure(title='test data',
             plot_height=700, plot_width=1000,
             height_policy = 'max',
             x_axis_type='datetime',
             x_range=(start_date, end_date),
             y_range=(y_min, y_max),
             tools = 'pan,box_zoom,ywheel_zoom,zoom_out,zoom_in,reset,save,help',
             toolbar_location='above')

fig.yaxis.axis_label = 'Number'
fig.yaxis.axis_label_text_font_size = '20pt'
fig.yaxis.major_label_text_font_size = '18pt'

fig.xaxis.major_label_text_font_size = '18pt'

fig.title.text_font_size = '14pt'

hover_tool = HoverTool(tooltips=
                       [('N', '@y'), ('Date', '$x{%F}')],
                       mode='vline',
                       formatters={"$x": "datetime"})
fig.add_tools(hover_tool)


# finesse datetime tick formatting
fig.xaxis.formatter = DatetimeTickFormatter(days='%b\n%d',months='%b\n%Y')

# Draw the coordinates as circles
fig.circle(x=x, y=y,
           fill_color = mapper,
           size=10, alpha=0.7)

# Show plot
show(fig)

# END =========================================================================