☰Read-only archive⌕
Looking for help with Bokeh?

This is a read-only archive. Ask questions and join the conversation on GitHub.

Visit Community Support on GitHub →
Archived discussions · Captured October 28, 2026

Y_axis is not displaying complete range value

Community Support
jballinas
jballinas

Hello all! :slight_smile:

I’m getting stuck with my code:

let me explain my problem, this is part of my code:

    TOOLTIPS = [
                ("Tipo de plan", "@plan_id"),
                ("total", "@total"),
                ]
    p = figure(x_range=src['plan_id'], plot_height=350, title="Fruit Counts by Year", toolbar_location=None, tools="hover", tooltips= TOOLTIPS)
    p.vbar(x='plan_id', top='total', width=0.7, source=source, line_color='white', alpha=0.6, legend_field= 'plan_id')

when the value of my data is bigger or smaller than 9, y-axis is correct but when the value is 9, y_axis is not showing the correct range value:
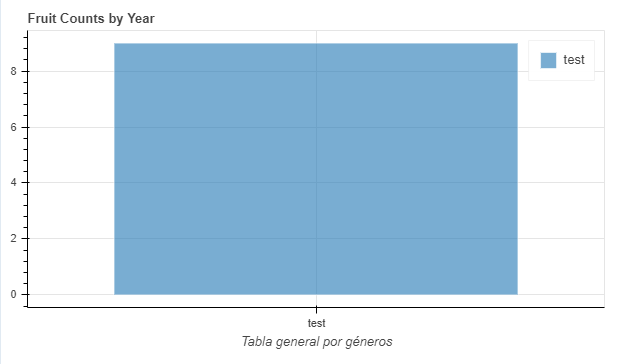
image

Is this a problem with my code?

⌁   Link to post
Bryan
Bryan

@jballinas It’s not clear what you are asking about. Are you saying you want different tick values displayed on the axis? By default Bokeh always picks “nice” tick numbers (generally, multiples of 1, 2 and 5) so if you want something different that that you would have to tell it. But it’ s not clear what you are asking for.

⌁   Link to post
jballinas
jballinas

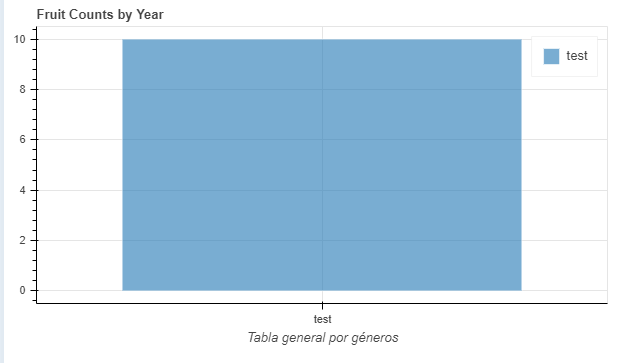
Thank you @Bryan for your reply, I’ve tried to upload two images but I’m a new member. In this picture y_axis is showing the correcting tick value of my chart.

10-value

Oh, is correct!!! only values multiples of 1, 2, 5 are displayed. Now I need to adjust y_range option in my code.

Thank you again!!!

⌁   Link to post

End of archived discussion · Replies are disabled