Y_axis label not properly rendering

import bokeh
bokeh.__version__

Output: BokehJS 2.1.0 successfully loaded.

from bokeh.io import output_notebook, show
from bokeh.plotting import figure
output_notebook()
Year = ['1950','1955', '1960','1965', '1970','1975', '1980','1985', '1990','1995','2000','2005','2010']
Growth = [15, 20, 25, 30, 35, 40,45,50,55,60,65,70,75]

plot = figure(x_range=Year,y_range=(0, 100),plot_height=350, title="Population Increase",
           toolbar_location=None, tools="")
plot.xaxis.axis_label = "Year"
plot.yaxis.axis_label = "Population(in Millions)"
plot.vbar(x=Year, top=Growth, width=0.8,color="#6666ff")

plot.xgrid.grid_line_color = None

plot.y_range.start = 0

show(plot)

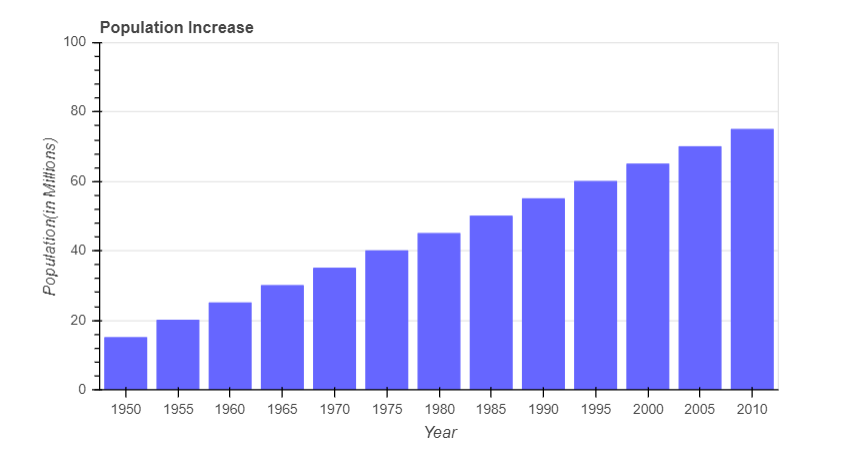
the issue I am facing that is Y_axis LABEL is not rendering properly,I searched the discourse and stack overflow,I am not sure that I found a solution…pls help on how to remove this error??

In Jupyter notebooks:
And there is also one another behaviour that is really annoying that once u have declared output_file intentional or by mistake,It will make all the cells in jupyter notebooks to do both show graph in notebook and show it in new tab,how to solve it?

@Ashwani_Rathee You are going to have to elaborate. In your code you have

plot.yaxis.axis_label = "Population(in Millions)"

And in the image you show the plot displays Population(in Millions) on the y-axis, exactly as expected. What do you think should be happening? What does “not rendering properly” actually mean, in specific detail?

For the other, output_file activates a persistent mode, this is its purpose. You should avoid calling it if that is not what you want. instead, one-off HTML files can be saved with save, or alternatively you can call reset_output in order to “cancel” a previous call to output_file.

@Bryan What I meant by “not rendering properly” is that it looks little ugly on the graph…

For the other,I understood your solution to it…

@Ashwani_Rathee We just use standard HTML Canvas drawText APIs to render text. Unfortunately different browsers and platforms are not identical in how their implementations of HTML canvas performs in every situation. This is definitely system/platform/browser specific, since similar examples on the gallery page render sharply for me:

Offhand the only thing I can think is to try different font types, sizes, etc. to see if the canvas renders them more satisfactorily for you.

1 Like