I’m using bokeh 0.60 on a mac. I’ve tried on pc also. I’m using google chrome as the web browser and ipython notebook.
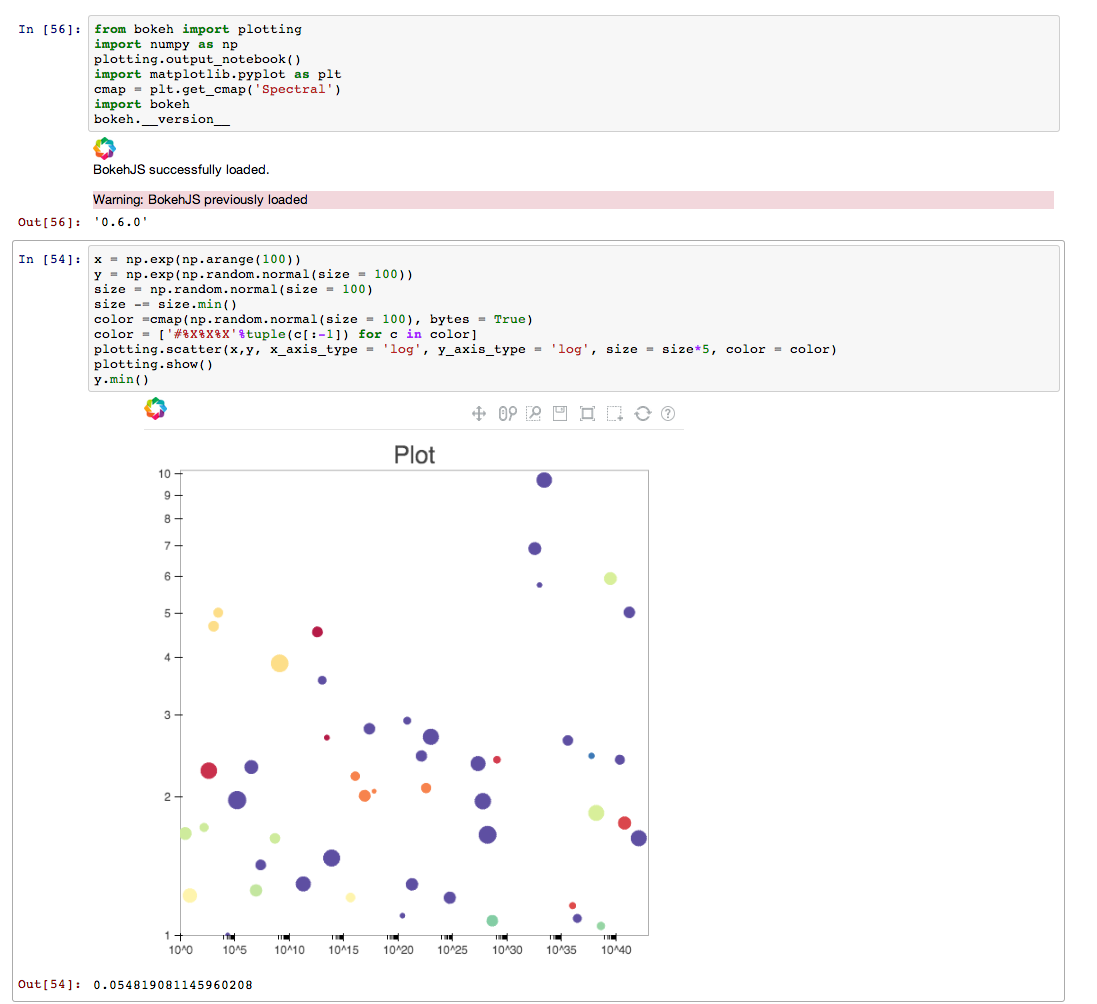
I’ve been trying to use y_axis_type = ‘log’ and the same for the x_axis. It appears that even though my data starts well below 1. Say .05 which is quite far in log space, bokeh’s default zoom starts the y_axis at 1. It get this right when not in log mode. I suspect the zoomer is not taking the log space into account. I’ve seen the bug in other plotting libs before. You can see in the screenshot that the output of the y.min() is ~ .05 which is much smaller than 1.0. If you pan the plot up you will see a considerable amount of data below 1.
This is the python export of the ipython notebook that produced this example:
coding: utf-8
In[56]:
from bokeh import plotting
import numpy as np
plotting.output_notebook()
import matplotlib.pyplot as plt
cmap = plt.get_cmap(‘Spectral’)
import bokeh
bokeh.version
In[54]:
x = np.exp(np.arange(100))
y = np.exp(np.random.normal(size = 100))
size = np.random.normal(size = 100)
size -= size.min()
color =cmap(np.random.normal(size = 100), bytes = True)
I'm using bokeh 0.60 on a mac. I've tried on pc also. I'm using google chrome as the web browser and ipython notebook.
I've been trying to use y_axis_type = 'log' and the same for the x_axis. It appears that even though my data starts well below 1. Say .05 which is quite far in log space, bokeh's default zoom starts the y_axis at 1. It get this right when not in log mode. I suspect the zoomer is not taking the log space into account. I've seen the bug in other plotting libs before. You can see in the screenshot that the output of the y.min() is ~ .05 which is much smaller than 1.0. If you pan the plot up you will see a considerable amount of data below 1.
This is the python export of the ipython notebook that produced this example:
# coding: utf-8
# In[56]:
from bokeh import plotting
import numpy as np
plotting.output_notebook()
import matplotlib.pyplot as plt
cmap = plt.get_cmap('Spectral')
import bokeh
bokeh.__version__
# In[54]:
x = np.exp(np.arange(100))
y = np.exp(np.random.normal(size = 100))
size = np.random.normal(size = 100)
size -= size.min()
color =cmap(np.random.normal(size = 100), bytes = True)
On Tuesday, September 16, 2014 9:51:14 PM UTC-4, Tom wrote:
I’m using bokeh 0.60 on a mac. I’ve tried on pc also. I’m using google chrome as the web browser and ipython notebook.
I’ve been trying to use y_axis_type = ‘log’ and the same for the x_axis. It appears that even though my data starts well below 1. Say .05 which is quite far in log space, bokeh’s default zoom starts the y_axis at 1. It get this right when not in log mode. I suspect the zoomer is not taking the log space into account. I’ve seen the bug in other plotting libs before. You can see in the screenshot that the output of the y.min() is ~ .05 which is much smaller than 1.0. If you pan the plot up you will see a considerable amount of data below 1.
This is the python export of the ipython notebook that produced this example:
coding: utf-8
In[56]:
from bokeh import plotting
import numpy as np
plotting.output_notebook()
import matplotlib.pyplot as plt
cmap = plt.get_cmap(‘Spectral’)
import bokeh
bokeh.version
In[54]:
x = np.exp(np.arange(100))
y = np.exp(np.random.normal(size = 100))
size = np.random.normal(size = 100)
size -= size.min()
color =cmap(np.random.normal(size = 100), bytes = True)