# Here is a list of categorical values (or factors)
fruits = ['Apples', 'Pears', 'Nectarines', 'Plums', 'Grapes', 'Strawberries']

# Set the x_range to the list of categories above
p = figure(x_range=fruits, plot_height=250, title="Fruit Counts")

# Categorical values can also be used as coordinates
p.vbar(x=fruits, top=[5, 3, 4, 2, 4, 6], width=0.9)

# Set some properties to make the plot look better
p.xgrid.grid_line_color = None
p.y_range.start = 0

show(p)
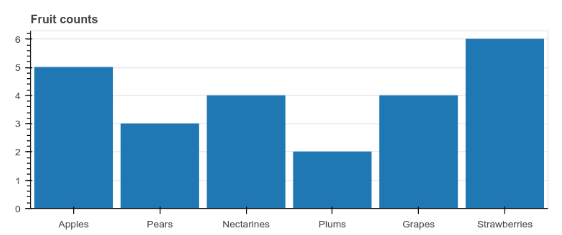
Where is the blue color coming from?
Where are we told this color is the default, even when the plot code itself makes no reference to color of any kind - including in the imports?
In the plot above, we passed the list of fruits as x_range, and we can see those refelected (sic) as the x-axis.
What exactly is the difference b/w x_range and x-axis? Here they are synonymous.
# Create a stacked bar chart with a single call to vbar_stack
from bokeh.palettes import GnBu3

years = ['2015', '2016', '2017', '2018', '2019', '2020']

exports = {'meds' : meds,
           '2015'   : [2, 1, 4, 3, 2, 4],
           '2016'   : [5, 3, 4, 2, 4, 6],
           '2017'   : [3, 2, 4, 4, 5, 3],
           '2018'   : [2, 1, 4, 3, 2, 4],
           '2019'   : [5, 3, 4, 2, 4, 6],
           '2020'   : [3, 2, 4, 4, 5, 3]}

p = figure(y_range=meds, plot_height=250, x_range=(0, 16), title="can you stack a bar?")

p.vbar_stack(years, x=meds, height=0.9, color=GnBu3, source=ColumnDataSource(exports),
             legend_label=["%s meds" % x for x in years])

p.y_range.range_padding = 0.1
p.ygrid.grid_line_color = None
p.legend.location = "center_left"

show(p)
---> 83         raise ValueError("Keyword argument sequences for broadcasting must all be the same lengths. Got lengths: %r" % sorted(list(lengths)))
     84     if lengths.pop() != len(stackers):
     85         raise ValueError("Keyword argument sequences for broadcasting must be the same length as stackers")

ValueError: Keyword argument sequences for broadcasting must all be the same lengths. Got lengths: [3, 6]
len(exports) 7
len(meds) 6
len(years) 6
stackers is len 3. Idk if this is a holdover from exports or imports, but it is a holdover from the original example plot. Note I removed imports from the explicit code. Note there is nothing in the code, examples, or text about stackers: what they are, how to set them, nothing!
File ~/.virtualenvs/chartify/lib/python3.9/site-packages/bokeh/plotting/_stack.py:83, in double_stack(stackers, spec0, spec1, **kw)
I suspect double_stack(), buried in the trace, is the problem, but where and how am I to remove it when the stated problem teaches me nothing about this method or the stackers var???
double_stack does not come up in a search of the docs: