Could you someone help us to plot 2D contour map from externally saved .text file ( three column: x-coordinate, y-coordinate and z-intensity) using Bokeh?
x and y are not evenly spaced (irregular) and for each (x,y) point there is intensity as z column.
Can you define what you mean by “2D contour map”? Do you mean a colormapped image (that implicitly shows iso-levels as a result of the encoding into a discrete set of colors)? Or do you mean a “topographic” map, i.e. a collection of iso-contour lines?
Its 1st one: colormapped image with out contour lines.
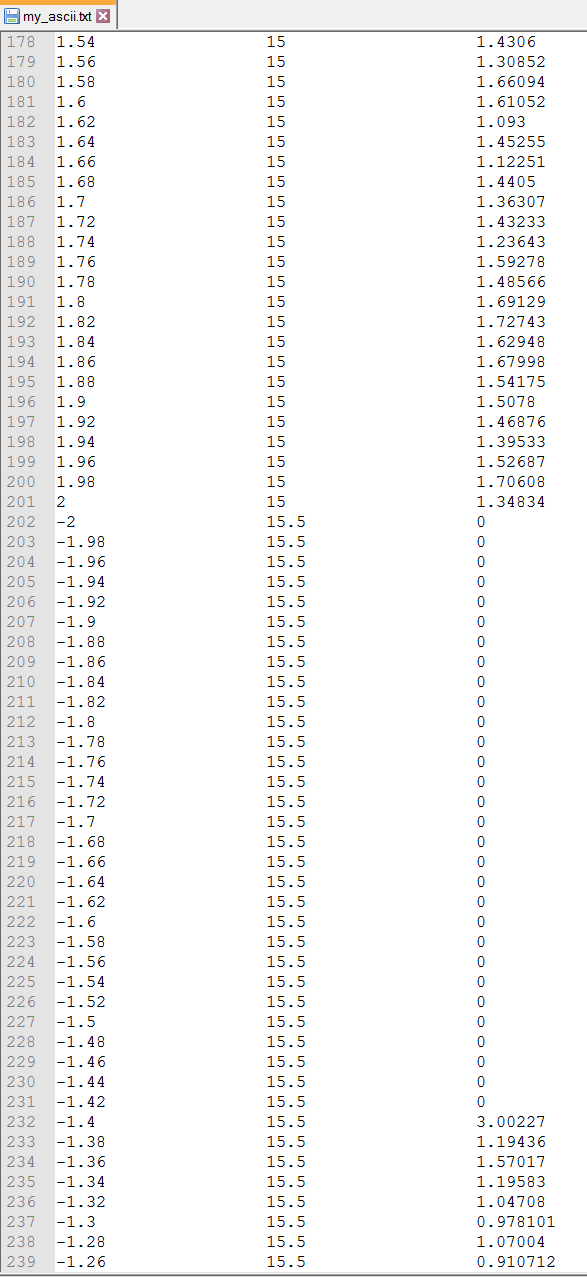
I have three column data x y z separated by space (please see the attached image).
y column increases in 0.5 steps (15 to 60) while for each y I have x (from -2 to 2) in step 0.02.
z column is the intensity for each (x,y) point.
It can be imagined as a matrix as 2-dimensional (x,y) space where we assign z as intensity on each (x,y).
I would like to plot all the (x,y) points in 2-dimension [x-coordinate, y-coordinate] and we will assign the corresponding z-values (intensity) as color.
I guess it can be done using other software but I like and feel Bokeh has its own fascinating way to plot and use fantastic colors
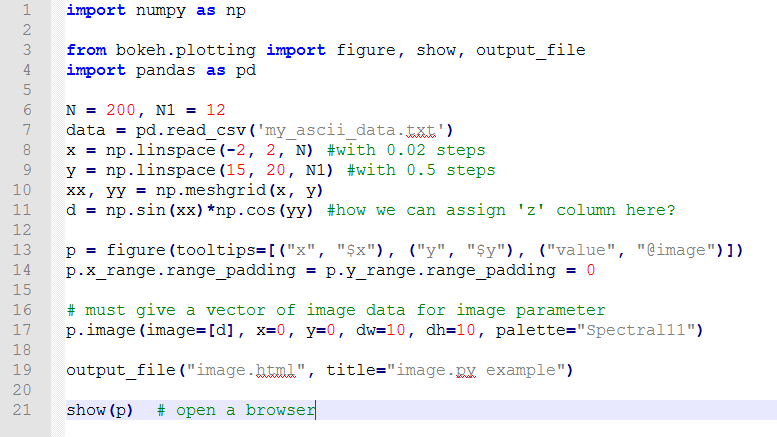
The image glyph method is probably the simplest option, it accepts a palette name (or you can pass an explicitly configured ColorMapper instance). You can see an example to emulate here:
Hi @jasman please always prefer to post code as actual formatted text, and not as screenshots Using screenshots means that other people cannot copy and paste parts fo it when they have questions. For instance, I am not sure what you mean when you ask
# how we can assign 'z' column here?
It’s not clear to me what you actually want to happen. If you just want a different name, you can replace the variable name d with z throughout, but I have to suspect you mean something more/different.
I have done this successfully using the matplotlib tricontour function. You can mostly follow Tricontour Demo — Matplotlib 3.1.0 documentation , except you’ll need a bit of array/data manipulation to transform the tricontour object into something you can plot in bokeh, i.e. an image or a column datasource containing x/y arrays for multiple patch objects representing each contour).