from bokeh.plotting import figure, show, output_file
from bokeh.models import Label, GlobalInlineStyleSheet
from bokeh.layouts import row
import numpy as np
def get_dark_stylesheet():
"""Create a new dark theme stylesheet instance."""
return GlobalInlineStyleSheet(css="""
html, body, .bk, .bk-root {
background-color: #343838;
margin: 0;
padding: 0;
height: 100%;
color: white;
font-family: 'Consolas', 'Courier New', monospace;
}
.bk { color: white; }
.bk-input, .bk-btn, .bk-select, .bk-slider-title, .bk-headers,
.bk-label, .bk-title, .bk-legend, .bk-axis-label {
color: white !important;
}
.bk-input::placeholder { color: #aaaaaa !important; }
""")
def get_light_stylesheet():
"""Create a new light theme stylesheet instance."""
return GlobalInlineStyleSheet(css="""
html, body, .bk, .bk-root {
background-color: #FDFBD4;
margin: 0;
padding: 0;
height: 100%;
color: black;
font-family: 'Consolas', 'Courier New', monospace;
}
.bk { color: black; }
.bk-input, .bk-btn, .bk-select, .bk-slider-title, .bk-headers,
.bk-label, .bk-title, .bk-legend, .bk-axis-label {
color: black !important;
}
.bk-input::placeholder { color: #555555 !important; }
""")
def darken_color(hex_color, factor=0.7):
"""
Darken a hex color by a factor.
Parameters:
-----------
hex_color : str
Hex color code (e.g., '#ff0000')
factor : float
Darkening factor (0-1, lower is darker)
Returns:
--------
str : Darkened hex color
"""
hex_color = hex_color.lstrip('#')
r, g, b = tuple(int(hex_color[i:i+2], 16) for i in (0, 2, 4))
r, g, b = int(r * factor), int(g * factor), int(b * factor)
return f'#{r:02x}{g:02x}{b:02x}'
def plot_3d_bars(categories, values, colors, labels=None,
title='3D Bar Chart', xlabel='', ylabel='',
width=800, height=600, bar_width=0.45,
dx=0.35, dy=80, dark_bg=True):
"""
Create a 3D bar chart with simple (non-stacked) bars.
Parameters:
-----------
categories : list
Category names for x-axis
values : list
Values for each category
colors : list
Colors for each bar
labels : list, optional
Labels for legend (if None, uses categories)
title : str
Chart title
xlabel, ylabel : str
Axis labels
width, height : int
Figure dimensions
bar_width : float
Width of bars (0-1)
dx, dy : float
3D depth offsets (horizontal and vertical)
dark_bg : bool
Use dark background theme
Returns:
--------
bokeh figure object
"""
# Validate inputs
if len(categories) != len(values) != len(colors):
raise ValueError("categories, values, and colors must have same length")
# Theme colors
bg_color = '#343838' if dark_bg else '#FDFBD4'
text_color = 'white' if dark_bg else 'black'
grid_color = '#404040' if dark_bg else '#e0e0e0'
# Calculate y-range with padding
max_val = max(values) * 1.5
# Create figure
p = figure(
width=width,
height=height,
title=title,
x_range=(-0.5, len(categories)),
y_range=(-10, max_val),
toolbar_location='right',
tools='pan,wheel_zoom,reset,save',
background_fill_color=bg_color,
border_fill_color=bg_color,
)
# Apply styling
p.title.text_color = text_color
p.title.text_font_size = '18pt'
p.title.text_font_style = 'bold'
p.xgrid.grid_line_color = grid_color
p.ygrid.grid_line_color = grid_color
p.xaxis.axis_line_color = text_color
p.yaxis.axis_line_color = text_color
p.xaxis.major_tick_line_color = text_color
p.yaxis.major_tick_line_color = text_color
p.xaxis.minor_tick_line_color = None
p.yaxis.minor_tick_line_color = None
p.xaxis.major_label_text_color = text_color
p.yaxis.major_label_text_color = text_color
p.xaxis.major_label_text_font_size = '11pt'
p.yaxis.major_label_text_font_size = '11pt'
p.outline_line_color = None
p.xaxis.ticker = list(range(len(categories)))
p.xaxis.major_label_overrides = {i: cat for i, cat in enumerate(categories)}
if ylabel:
p.yaxis.axis_label = ylabel
p.yaxis.axis_label_text_color = text_color
p.yaxis.axis_label_text_font_size = '12pt'
# Draw 3D bars
for i, (value, color) in enumerate(zip(values, colors)):
x_left = i - bar_width/2
x_right = i + bar_width/2
# Right side face (darker)
right_x = [x_right, x_right + dx, x_right + dx, x_right, x_right]
right_y = [0, dy, value + dy, value, 0]
p.patch(right_x, right_y, color=darken_color(color, 0.6),
alpha=1.0, line_color='#000000', line_width=1)
# Top face (medium shade)
top_x = [x_left, x_right, x_right + dx, x_left + dx, x_left]
top_y = [value, value, value + dy, value + dy, value]
p.patch(top_x, top_y, color=darken_color(color, 0.8),
alpha=1.0, line_color='#000000', line_width=1)
# Front face (brightest)
p.quad(left=[x_left], right=[x_right], bottom=[0], top=[value],
color=color, alpha=1.0, line_color='#000000', line_width=1.5)
return p
def plot_3d_stacked_bars(categories, data_dict, colors, labels,
title='3D Stacked Bar Chart', xlabel='', ylabel='',
width=800, height=600, bar_width=0.45,
dx=0.35, dy=80, dark_bg=True):
"""
Create a 3D stacked bar chart.
Parameters:
-----------
categories : list
Category names for x-axis
data_dict : dict
Dictionary mapping categories to lists of values (bottom to top)
colors : list
Colors for each stack segment
labels : list
Labels for each stack segment
title : str
Chart title
xlabel, ylabel : str
Axis labels
width, height : int
Figure dimensions
bar_width : float
Width of bars (0-1)
dx, dy : float
3D depth offsets (horizontal and vertical)
dark_bg : bool
Use dark background theme
Returns:
--------
bokeh figure object
"""
# Validate inputs
if not all(cat in data_dict for cat in categories):
raise ValueError("data_dict must contain all categories")
# Theme colors
bg_color = '#343838' if dark_bg else '#FDFBD4'
text_color = 'white' if dark_bg else 'black'
grid_color = '#404040' if dark_bg else '#e0e0e0'
# Calculate y-range
max_val = max(sum(data_dict[cat]) for cat in categories) * 1.4
# Create figure
p = figure(
width=width,
height=height,
title=title,
x_range=(-0.5, len(categories)),
y_range=(-50, max_val),
toolbar_location='right',
tools='pan,wheel_zoom,reset,save',
background_fill_color=bg_color,
border_fill_color=bg_color,
)
# Apply styling
p.title.text_color = text_color
p.title.text_font_size = '18pt'
p.title.text_font_style = 'bold'
p.xgrid.grid_line_color = grid_color
p.ygrid.grid_line_color = grid_color
p.xaxis.axis_line_color = text_color
p.yaxis.axis_line_color = text_color
p.xaxis.major_tick_line_color = text_color
p.yaxis.major_tick_line_color = text_color
p.xaxis.minor_tick_line_color = None
p.yaxis.minor_tick_line_color = None
p.xaxis.major_label_text_color = text_color
p.yaxis.major_label_text_color = text_color
p.xaxis.major_label_text_font_size = '11pt'
p.yaxis.major_label_text_font_size = '11pt'
p.outline_line_color = None
p.xaxis.ticker = list(range(len(categories)))
p.xaxis.major_label_overrides = {i: cat for i, cat in enumerate(categories)}
if ylabel:
p.yaxis.axis_label = ylabel
p.yaxis.axis_label_text_color = text_color
p.yaxis.axis_label_text_font_size = '12pt'
# Draw 3D stacked bars
for i, category in enumerate(categories):
cumulative = 0
category_data = data_dict[category]
for j, (value, color) in enumerate(zip(category_data, colors)):
bottom = cumulative
top = cumulative + value
x_left = i - bar_width/2
x_right = i + bar_width/2
# Right side face (darker)
right_x = [x_right, x_right + dx, x_right + dx, x_right, x_right]
right_y = [bottom, bottom + dy, top + dy, top, bottom]
p.patch(right_x, right_y, color=darken_color(color, 0.6),
alpha=1.0, line_color='#000000', line_width=1)
# Top face (only for top segment)
if j == len(category_data) - 1:
top_x = [x_left, x_right, x_right + dx, x_left + dx, x_left]
top_y = [top, top, top + dy, top + dy, top]
p.patch(top_x, top_y, color=darken_color(color, 0.8),
alpha=1.0, line_color='#000000', line_width=1)
# Front face (brightest)
p.quad(left=[x_left], right=[x_right], bottom=[bottom], top=[top],
color=color, alpha=1.0, line_color='#000000', line_width=1.5)
cumulative = top
return p
def create_legend(labels, colors, dark_bg=True, height=600):
"""
Create a separate legend figure.
Parameters:
-----------
labels : list
Legend labels
colors : list
Colors corresponding to labels
dark_bg : bool
Use dark background theme
height : int
Height of legend figure
Returns:
--------
bokeh figure object
"""
text_color = 'white' if dark_bg else 'black'
bg_color = '#343838' if dark_bg else '#FDFBD4'
# Calculate required height based on number of items
item_height = 40 # Height per legend item
total_height = len(labels) * item_height + 60
legend_fig = figure(
width=250,
height=min(total_height, height),
toolbar_location=None,
background_fill_color=bg_color,
border_fill_color=bg_color,
outline_line_color=None,
x_range=(0, 1),
y_range=(0, len(labels) * item_height + 20)
)
# Remove axes and grid
legend_fig.xaxis.visible = False
legend_fig.yaxis.visible = False
legend_fig.xgrid.visible = False
legend_fig.ygrid.visible = False
# Add legend items from top to bottom
for i, (label, color) in enumerate(zip(labels, colors)):
y_pos = (len(labels) - i) * item_height - 10
# Colored circle
legend_fig.circle(x=[0.1], y=[y_pos], size=18, color=color,
alpha=1.0, line_color='#000000', line_width=2)
# Label text positioned right next to the circle
label_obj = Label(
x=0.18, y=y_pos - 7,
text=label,
text_color=text_color,
text_font_size='12pt'
)
legend_fig.add_layout(label_obj)
return legend_fig
# ============================================================================
# EXAMPLE USAGE
# ============================================================================
if __name__ == "__main__":
from bokeh.io import reset_output
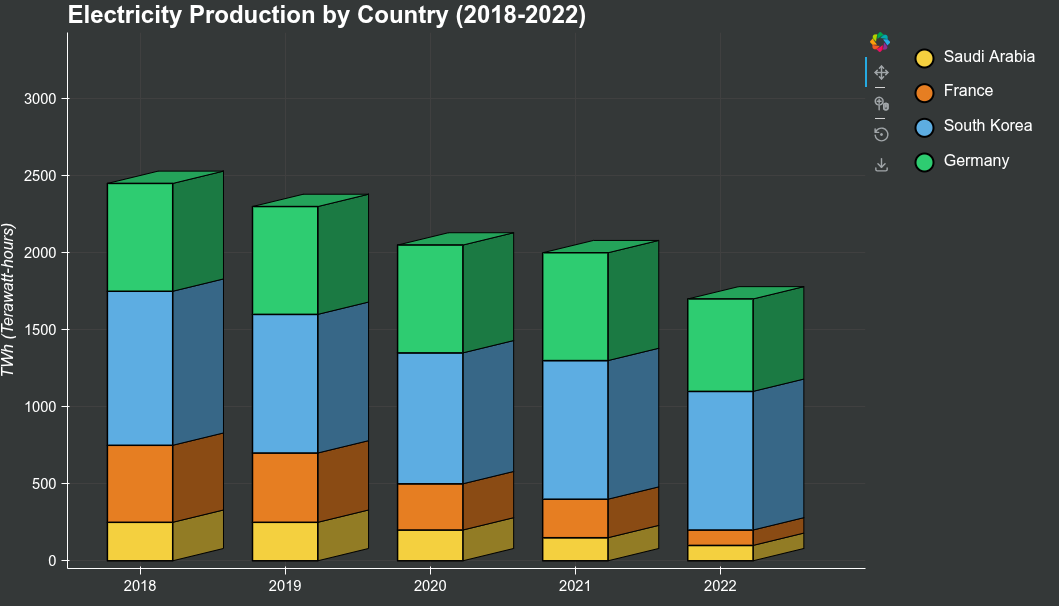
# Example 1: 3D Stacked Bar Chart - Electricity Production (Dark Theme)
print("Creating 3D Stacked Bar Chart...")
reset_output()
years = ['2018', '2019', '2020', '2021', '2022']
countries = ['Saudi Arabia', 'France', 'South Korea', 'Germany']
colors_stacked = ['#f4d03f', '#e67e22', '#5dade2', '#2ecc71']
data = {
'2018': [250, 500, 1000, 700],
'2019': [250, 450, 900, 700],
'2020': [200, 300, 850, 700],
'2021': [150, 250, 900, 700],
'2022': [100, 100, 900, 600]
}
stacked_chart = plot_3d_stacked_bars(
categories=years,
data_dict=data,
colors=colors_stacked,
labels=countries,
title='Electricity Production by Country (2018-2022)',
ylabel='TWh (Terawatt-hours)',
width=900,
height=600
)
legend_stacked = create_legend(countries, colors_stacked)
layout_stacked = row(stacked_chart, legend_stacked, stylesheets=[get_dark_stylesheet()])
output_file("3d_stacked_bar_chart.html")
show(layout_stacked)
# Example 2: Simple 3D Bar Chart - Quarterly Sales (Light Theme)
print("Creating Simple 3D Bar Chart - Quarterly Sales...")
reset_output()
categories = ['Q1', 'Q2', 'Q3', 'Q4']
values = [450, 580, 620, 700]
colors_simple = ['#3498db', '#e74c3c', '#2ecc71', '#f39c12']
labels_simple = ['Quarter 1', 'Quarter 2', 'Quarter 3', 'Quarter 4']
simple_chart = plot_3d_bars(
categories=categories,
values=values,
colors=colors_simple,
labels=labels_simple,
title='Quarterly Sales Performance - 2024',
ylabel='Revenue ($K)',
width=900,
height=600,
dark_bg=False
)
legend_simple = create_legend(labels_simple, colors_simple, dark_bg=False)
layout_simple = row(simple_chart, legend_simple, stylesheets=[get_light_stylesheet()])
output_file("3d_simple_bar_chart.html")
show(layout_simple)
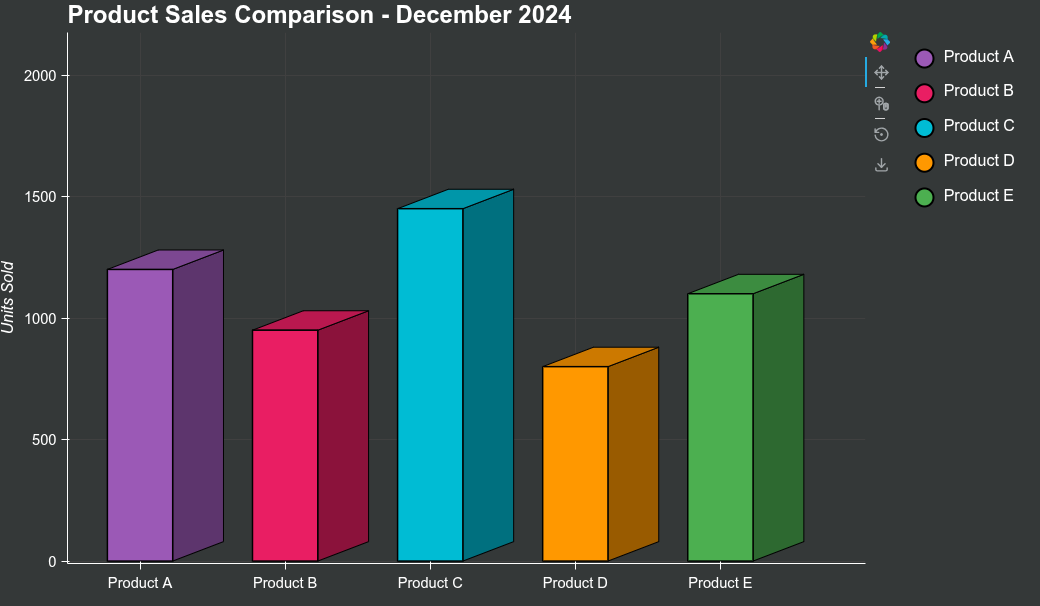
# Example 3: Product Sales Comparison (Dark Theme)
print("Creating Product Sales Chart...")
reset_output()
products = ['Product A', 'Product B', 'Product C', 'Product D', 'Product E']
sales = [1200, 950, 1450, 800, 1100]
colors_products = ['#9b59b6', '#e91e63', '#00bcd4', '#ff9800', '#4caf50']
product_chart = plot_3d_bars(
categories=products,
values=sales,
colors=colors_products,
labels=products,
title='Product Sales Comparison - December 2024',
ylabel='Units Sold',
width=900,
height=600
)
legend_products = create_legend(products, colors_products)
layout_products = row(product_chart, legend_products, stylesheets=[get_dark_stylesheet()])
output_file("3d_product_sales.html")
show(layout_products)
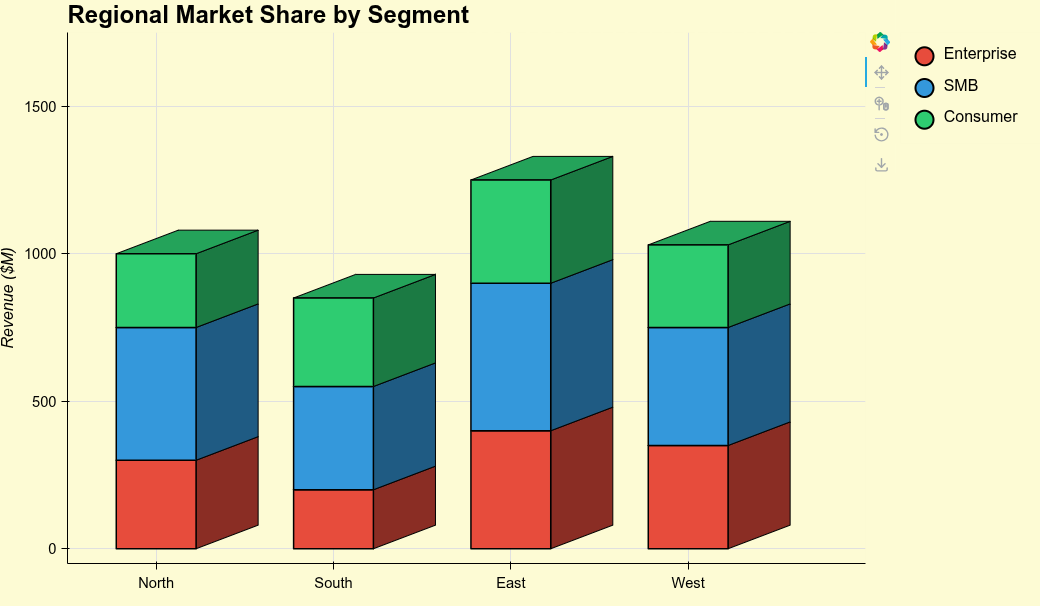
# Example 4: Regional Market Share Stacked (Light Theme)
print("Creating Regional Market Share Chart...")
reset_output()
regions = ['North', 'South', 'East', 'West']
segments = ['Enterprise', 'SMB', 'Consumer']
colors_segments = ['#e74c3c', '#3498db', '#2ecc71']
market_data = {
'North': [300, 450, 250],
'South': [200, 350, 300],
'East': [400, 500, 350],
'West': [350, 400, 280]
}
market_chart = plot_3d_stacked_bars(
categories=regions,
data_dict=market_data,
colors=colors_segments,
labels=segments,
title='Regional Market Share by Segment',
ylabel='Revenue ($M)',
width=900,
height=600,
dark_bg=False
)
legend_market = create_legend(segments, colors_segments, dark_bg=False)
layout_market = row(market_chart, legend_market, stylesheets=[get_light_stylesheet()])
output_file("3d_market_share.html")
show(layout_market)
1 Like