Using CustomJS to handle the interactions is much faster (standalone interactive plot):
"""
Interactive 3D Surface Plotter with Real-Time CustomJS Rotation
No Bokeh server needed - all interactivity in browser!
"""
import numpy as np
from bokeh.plotting import figure, show, output_file
from bokeh.models import (ColumnDataSource, CustomJS, Slider, Button,
TextInput, Select, Div, LinearColorMapper, ColorBar)
from bokeh.layouts import column, row
from bokeh.palettes import (Viridis256, Plasma256, Inferno256, Magma256,
Cividis256, Turbo256)
# Global parameters
n_points = 30
x_range = (-3, 3)
y_range = (-3, 3)
# Color palettes dictionary
PALETTES = {
"Viridis": Viridis256,
"Plasma": Plasma256,
"Inferno": Inferno256,
"Magma": Magma256,
"Cividis": Cividis256,
"Turbo": Turbo256
}
def compute_initial_surface(equation_str):
"""Compute initial surface data - just X, Y, Z coordinates"""
try:
# Create grid
x = np.linspace(x_range[0], x_range[1], n_points)
y = np.linspace(y_range[0], y_range[1], n_points)
X, Y = np.meshgrid(x, y)
# Evaluate equation
namespace = {'np': np, 'X': X, 'Y': Y}
Z = eval(equation_str, {"__builtins__": {}}, namespace)
return {
'X': X.flatten().tolist(),
'Y': Y.flatten().tolist(),
'Z': Z.flatten().tolist(),
'z_min': float(Z.min()),
'z_max': float(Z.max())
}, None
except Exception as e:
return None, str(e)
# Initial computation
initial_equation = "np.sin(X*2) * np.cos(Y*2)"
raw_data, error = compute_initial_surface(initial_equation)
if error or raw_data is None:
print(f"Error: {error}")
raw_data = {
'X': [0, 1, 1, 0],
'Y': [0, 0, 1, 1],
'Z': [0, 0, 1, 1],
'z_min': 0,
'z_max': 1
}
# Create data sources
# Raw source holds X, Y, Z data
raw_source = ColumnDataSource(data={
'X': raw_data['X'],
'Y': raw_data['Y'],
'Z': raw_data['Z']
})
# Quad source holds rendered surface
quad_source = ColumnDataSource(data={
'xs': [[]],
'ys': [[]],
'fill_color': ['#440154']
})
# Create figure
plot = figure(
width=1000, height=700,
title="Interactive 3D Surface - Real-Time Rotation (No Server!)",
toolbar_location=None,
match_aspect=False
)
# Create surface
surface = plot.patches(
xs='xs', ys='ys',
source=quad_source,
fill_color='fill_color',
fill_alpha=1,
line_color='#306998',
line_alpha=0.3,
line_width=0.5
)
# Style
plot.xaxis.visible = False
plot.yaxis.visible = False
plot.background_fill_color = "#f5f5f5"
plot.border_fill_color = "#f5f5f5"
# Color mapper and color bar
color_mapper = LinearColorMapper(
palette=Viridis256,
low=raw_data['z_min'],
high=raw_data['z_max']
)
color_bar = ColorBar(
color_mapper=color_mapper,
width=15,
location=(0, 0),
title="Z",
title_text_font_size="12pt"
)
plot.add_layout(color_bar, "right")
# Controls
equation_input = TextInput(
value=initial_equation,
title="Equation (use X, Y, np.sin, np.cos, np.exp, etc.):",
width=500
)
preset_select = Select(
title="Presets:",
value="Custom",
width=500,
options=[
"Custom",
"np.sin(X*2) * np.cos(Y*2)",
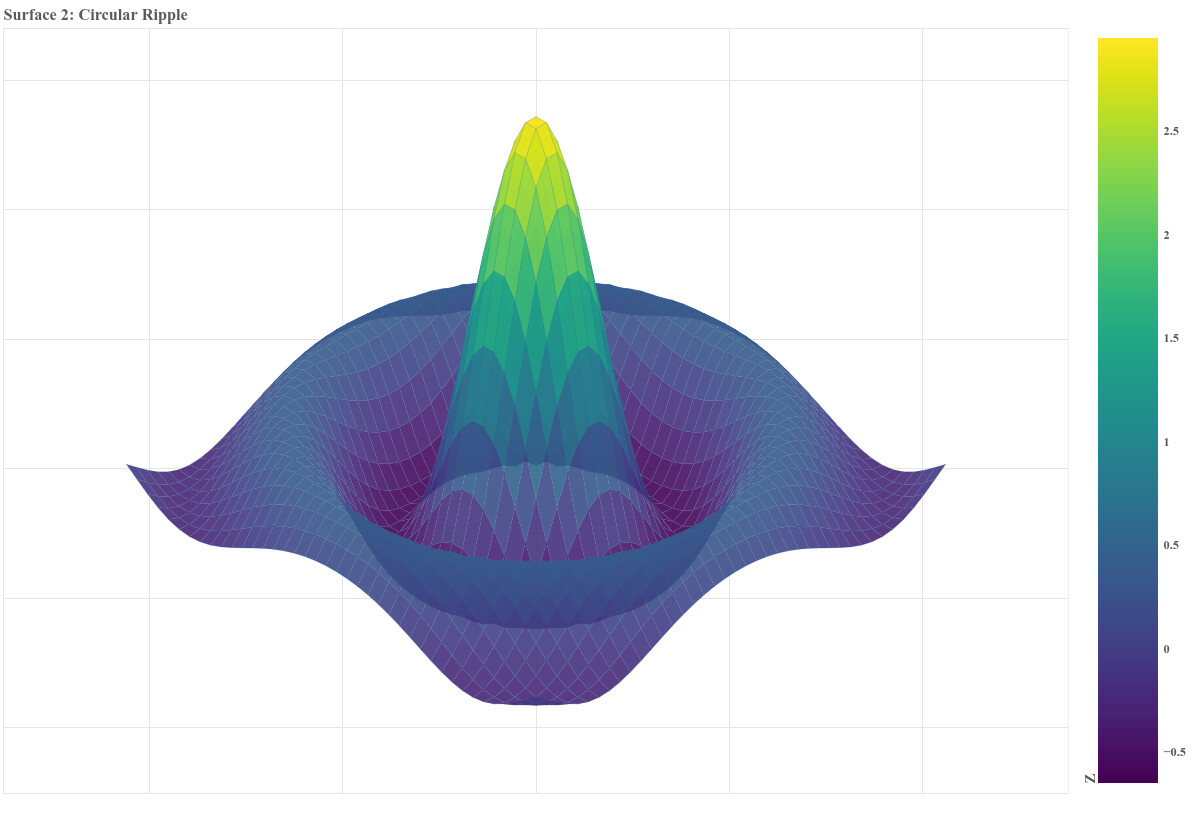
"np.sin(3*np.sqrt(X**2 + Y**2))/(np.sqrt(X**2 + Y**2) + 0.000001)",
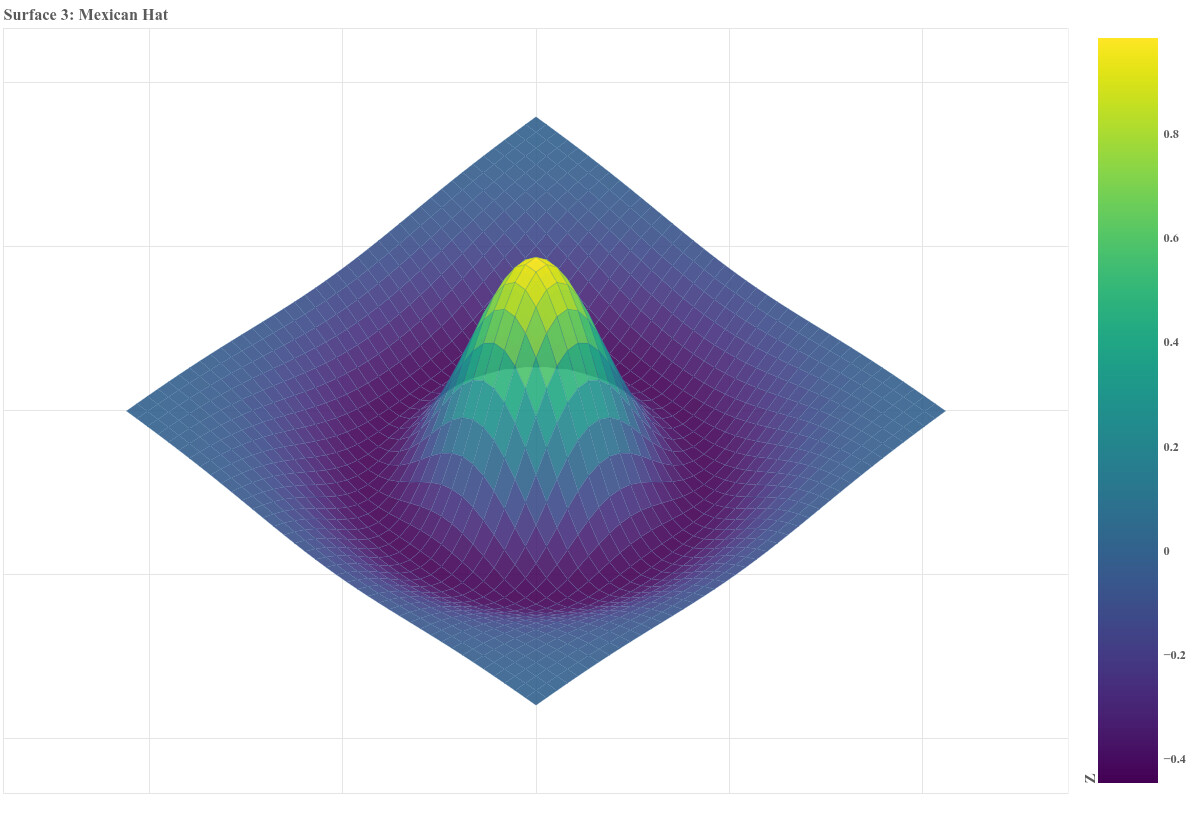
"(1 - (X**2 + Y**2)) * np.exp(-(X**2 + Y**2)/2)",
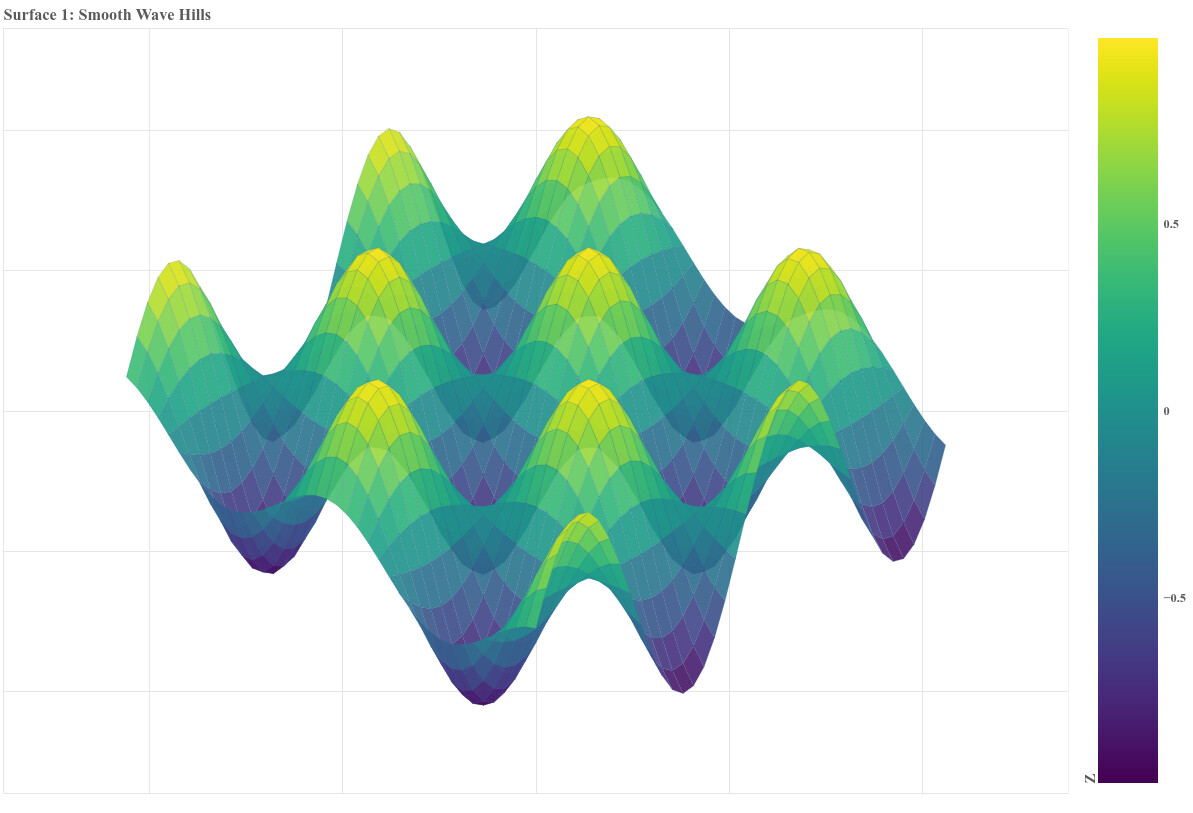
"np.sin(X)*np.cos(Y)",
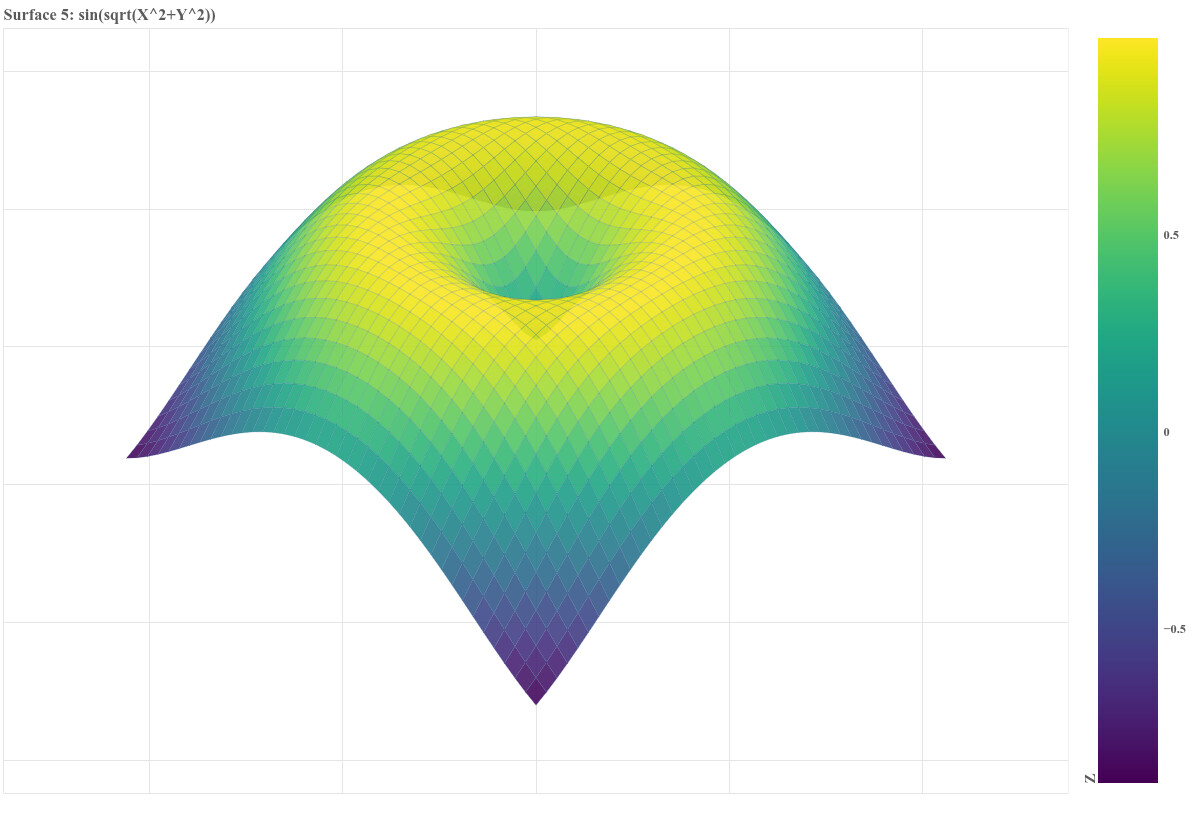
"np.sin(np.sqrt(X**2 + Y**2))",
"np.exp(-0.1*(X**2+Y**2))*np.sin(X*2)*np.cos(Y*2)",
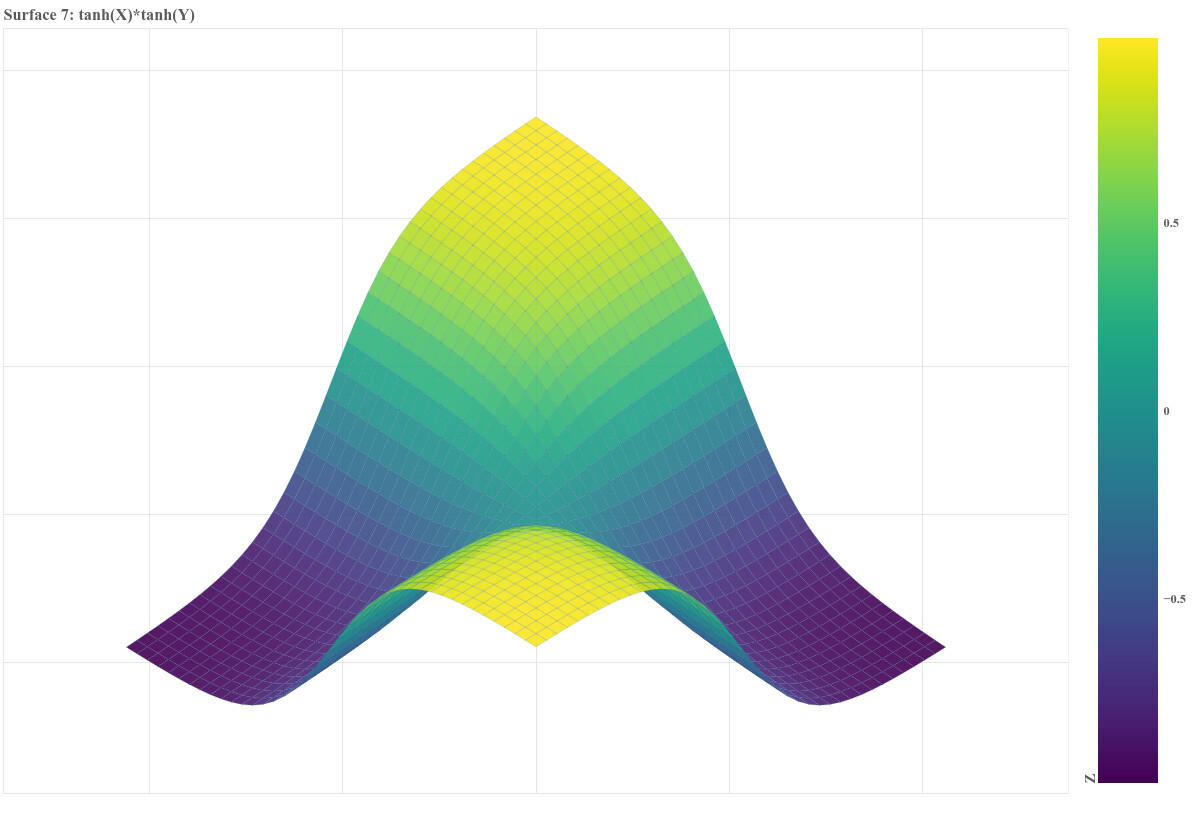
"np.tanh(X)*np.tanh(Y)",
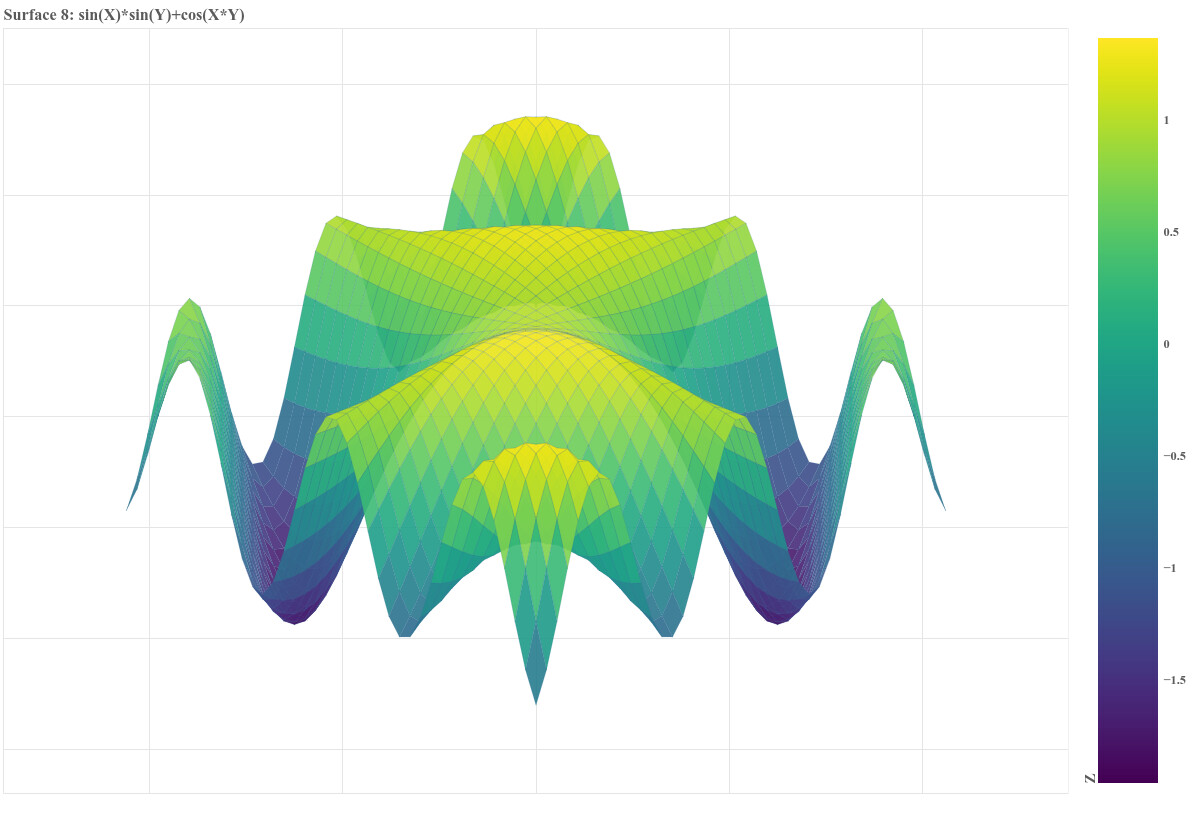
"np.sin(X)*np.sin(Y) + np.cos(X*Y)",
"X**2 - Y**2",
"np.sin(X)*np.exp(-(Y**2))",
"np.cos(X**2 + Y**2)",
"X**3 - 3*X*Y**2",
]
)
palette_select = Select(
title="Color Palette:",
value="Viridis",
width=250,
options=list(PALETTES.keys())
)
azim_slider = Slider(
start=0, end=360, value=45, step=1,
title="Azimuth (degrees)",
width=500
)
elev_slider = Slider(
start=-90, end=90, value=25, step=1,
title="Elevation (degrees)",
width=500
)
update_button = Button(
label="🔄 Update Surface",
button_type="success",
width=200
)
status_div = Div(
text="<div style='padding:10px; background:#e8f5e9; border-radius:5px;'>"
"<b>✓ Status:</b> Ready</div>",
width=500
)
# ============================================================================
# CUSTOMJS CALLBACK - Real-time rotation in browser!
# ============================================================================
import json
# Convert Python palettes to JS format
palette_js = {}
for name, colors in PALETTES.items():
palette_js[name] = str(list(colors))
rotation_callback = CustomJS(
args=dict(
raw_source=raw_source,
quad_source=quad_source,
azim_slider=azim_slider,
elev_slider=elev_slider,
palette_select=palette_select,
color_mapper=color_mapper,
plot=plot,
palette_viridis=json.dumps(Viridis256),
palette_plasma=json.dumps(Plasma256),
palette_inferno=json.dumps(Inferno256),
palette_magma=json.dumps(Magma256),
palette_cividis=json.dumps(Cividis256),
palette_turbo=json.dumps(Turbo256),
),
code="""
// Get rotation angles
const azim_deg = azim_slider.value;
const elev_deg = elev_slider.value;
const azim_rad = azim_deg * Math.PI / 180;
const elev_rad = elev_deg * Math.PI / 180;
// Get raw data
const X = raw_source.data['X'];
const Y = raw_source.data['Y'];
const Z = raw_source.data['Z'];
const n = Math.sqrt(X.length); // Grid size
// Get selected palette
const palettes = {
'Viridis': JSON.parse(palette_viridis),
'Plasma': JSON.parse(palette_plasma),
'Inferno': JSON.parse(palette_inferno),
'Magma': JSON.parse(palette_magma),
'Cividis': JSON.parse(palette_cividis),
'Turbo': JSON.parse(palette_turbo)
};
const palette = palettes[palette_select.value];
// Apply 3D rotation
const X_rot = new Array(X.length);
const Y_rot = new Array(Y.length);
const X_proj = new Array(X.length);
const Z_proj = new Array(Z.length);
for (let i = 0; i < X.length; i++) {
X_rot[i] = X[i] * Math.cos(azim_rad) - Y[i] * Math.sin(azim_rad);
Y_rot[i] = X[i] * Math.sin(azim_rad) + Y[i] * Math.cos(azim_rad);
X_proj[i] = X_rot[i];
Z_proj[i] = Y_rot[i] * Math.sin(elev_rad) + Z[i] * Math.cos(elev_rad);
}
// Find Z range for coloring
let z_min = Math.min(...Z);
let z_max = Math.max(...Z);
// Update color mapper
color_mapper.low = z_min;
color_mapper.high = z_max;
color_mapper.palette = palette;
// Create quads with depth sorting
const quads = [];
for (let i = 0; i < n - 1; i++) {
for (let j = 0; j < n - 1; j++) {
const idx0 = i * n + j;
const idx1 = i * n + (j + 1);
const idx2 = (i + 1) * n + (j + 1);
const idx3 = (i + 1) * n + j;
const xs = [X_proj[idx0], X_proj[idx1], X_proj[idx2], X_proj[idx3]];
const ys = [Z_proj[idx0], Z_proj[idx1], Z_proj[idx2], Z_proj[idx3]];
const avg_z = (Z[idx0] + Z[idx1] + Z[idx2] + Z[idx3]) / 4;
const depth = (Y_rot[idx0] + Y_rot[idx1] + Y_rot[idx2] + Y_rot[idx3]) / 4;
// Color mapping
let color_idx = 0;
if (z_max > z_min) {
color_idx = Math.floor((avg_z - z_min) / (z_max - z_min) * 255);
color_idx = Math.max(0, Math.min(255, color_idx));
}
quads.push({
depth: depth,
xs: xs,
ys: ys,
color: palette[color_idx]
});
}
}
// Sort by depth (painter's algorithm)
quads.sort((a, b) => b.depth - a.depth);
// Update quad source
const new_xs = quads.map(q => q.xs);
const new_ys = quads.map(q => q.ys);
const new_colors = quads.map(q => q.color);
quad_source.data['xs'] = new_xs;
quad_source.data['ys'] = new_ys;
quad_source.data['fill_color'] = new_colors;
// Auto-adjust plot ranges
const all_x = new_xs.flat();
const all_y = new_ys.flat();
const x_min = Math.min(...all_x);
const x_max = Math.max(...all_x);
const y_min = Math.min(...all_y);
const y_max = Math.max(...all_y);
const x_pad = (x_max - x_min) * 0.15;
const y_pad = (y_max - y_min) * 0.15;
plot.x_range.start = x_min - x_pad;
plot.x_range.end = x_max + x_pad;
plot.y_range.start = y_min - y_pad;
plot.y_range.end = y_max + y_pad;
quad_source.change.emit();
"""
)
# Attach real-time rotation to sliders
azim_slider.js_on_change('value', rotation_callback)
elev_slider.js_on_change('value', rotation_callback)
palette_select.js_on_change('value', rotation_callback)
# ============================================================================
# EQUATION UPDATE CALLBACK - Recompute surface
# ============================================================================
update_equation_callback = CustomJS(
args=dict(
equation_input=equation_input,
raw_source=raw_source,
status_div=status_div,
rotation_callback=rotation_callback,
n_points=n_points,
x_min=x_range[0],
x_max=x_range[1],
y_min=y_range[0],
y_max=y_range[1]
),
code="""
status_div.text = "<div style='padding:10px; background:#fff3cd; border-radius:5px;'><b>⏳ Status:</b> Computing...</div>";
try {
const equation = equation_input.value;
const n = n_points;
// Create grid
const X = [];
const Y = [];
const Z = [];
for (let i = 0; i < n; i++) {
for (let j = 0; j < n; j++) {
const x = x_min + (x_max - x_min) * i / (n - 1);
const y = y_min + (y_max - y_min) * j / (n - 1);
X.push(x);
Y.push(y);
// Create safe evaluation context
const np = {
sin: Math.sin,
cos: Math.cos,
tan: Math.tan,
exp: Math.exp,
log: Math.log,
sqrt: Math.sqrt,
abs: Math.abs,
tanh: Math.tanh,
sinh: Math.sinh,
cosh: Math.cosh,
PI: Math.PI,
E: Math.E
};
// Evaluate equation
try {
// Replace ** with Math.pow to avoid JS precedence issues
let safe_eq = equation
.replace(/\*\*/g, '__POW__'); // Temporary placeholder
// Substitute X and Y
safe_eq = safe_eq
.replace(/X/g, `(${x})`)
.replace(/Y/g, `(${y})`);
// Convert __POW__ to **
safe_eq = safe_eq.replace(/__POW__/g, '**');
// Replace np.* functions
safe_eq = safe_eq.replace(/np\./g, 'np.');
const z = eval(safe_eq);
Z.push(z);
} catch (e) {
throw new Error("Invalid equation: " + e.message);
}
}
}
// Update raw source
raw_source.data['X'] = X;
raw_source.data['Y'] = Y;
raw_source.data['Z'] = Z;
raw_source.change.emit();
// Trigger rotation to re-render
rotation_callback.execute(raw_source);
status_div.text = "<div style='padding:10px; background:#e8f5e9; border-radius:5px;'><b>✓ Status:</b> Updated successfully!</div>";
} catch (e) {
status_div.text = "<div style='padding:10px; background:#f8d7da; border-radius:5px;'><b>❌ Error:</b> " + e.message + "</div>";
}
"""
)
update_button.js_on_click(update_equation_callback)
# ============================================================================
# PRESET SELECTION CALLBACK
# ============================================================================
preset_callback = CustomJS(
args=dict(
preset_select=preset_select,
equation_input=equation_input,
update_equation_callback=update_equation_callback
),
code="""
if (preset_select.value !== 'Custom') {
equation_input.value = preset_select.value;
update_equation_callback.execute();
}
"""
)
preset_select.js_on_change('value', preset_callback)
# Layout
title_div = Div(text="""
<div style='text-align:center; padding:20px;
background:linear-gradient(135deg, #667eea 0%, #764ba2 100%);
border-radius:8px; margin-bottom:20px; color:white;'>
<h1 style='margin:0; font-size:2.5em;'>🎨 Interactive 3D Surface Plotter</h1>
<p style='margin:5px 0 0 0; font-size:1.2em;'>
Real-Time Rotation - No Server Required!
</p>
</div>
""", width=500)
instructions_div = Div(text="""
<div style='padding:15px; background:#f0f8ff; border-left:4px solid #667eea;
margin-bottom:15px; border-radius:5px;'>
<b>📝 Instructions:</b><br>
• Use NumPy functions: np.sin(), np.cos(), np.exp(), np.sqrt(), np.tanh(), etc.<br>
• Variables are <b>X</b> and <b>Y</b> (capital letters)<br>
• Examples: np.sin(X*2) * np.cos(Y*2), X**2 - Y**2, np.exp(-X**2-Y**2)<br>
• <b>Drag sliders for INSTANT rotation!</b><br>
• Choose different color palettes to visualize the surface
</div>
""", width=500)
controls = column(
row(preset_select),
row(equation_input),
column(azim_slider, elev_slider),
row(update_button, palette_select),
row(status_div)
)
layout = column(
row(
column(title_div, instructions_div, controls),
plot
)
)
# Trigger initial render
output_file("surface_plotter_customjs.html")
# Show the plot
show(layout)