Hello guys,
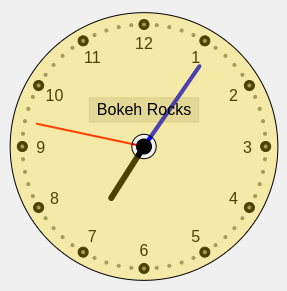
In case you need a clock ![]() .
.
from bokeh.io import show, curdoc, output_notebook
from bokeh.layouts import column
from bokeh.models import ColumnDataSource, CustomJS, Label, Rect, Annulus, ImageURLTexture
from bokeh.plotting import figure
import math

#output_notebook()

# Create a figure for the clock
p = figure(width=400, height=400, x_range=(-1.5, 1.5), y_range=(-1.5, 1.5), title="Clock")
p.axis.visible = False
p.grid.visible = False
p.background_fill_color = "#f0f0f0"

# Draw the clock face
for i in range(12):
    angle = 2 * math.pi * i / 12
    x = math.sin(angle)
    y = math.cos(angle)
    p.circle(x, y, size=10, color="black")

# Draw minute ticks
for i in range(60):
    angle = 2 * math.pi * i / 60
    x = math.sin(angle)
    y = math.cos(angle)
    p.circle(x, y, size=3, color="gray")

# Create data sources for the hands
hour_source = ColumnDataSource(data=dict(x=[0, 0], y=[0, 0]))
minute_source = ColumnDataSource(data=dict(x=[0, 0], y=[0, 0]))
second_source = ColumnDataSource(data=dict(x=[0, 0], y=[0, 0]))

# Draw the hands
p.line(x='x', y='y', source=hour_source, line_width=6, color="black", line_cap="round")
p.line(x='x', y='y', source=minute_source, line_width=4, color="blue", line_cap="round")
p.line(x='x', y='y', source=second_source, line_width=2, color="red", line_cap="round")

# Add a central circle
p.circle(0, 0, size=15, color="black")

tt = [12, 1, 2, 3, 4, 5, 6, 7, 8, 9, 10, 11]
RR = 0.85
# Add hour numbers around the clock face
for i in range(12):
    angle = 2 * math.pi * i / 12
    x = RR * math.sin(angle)
    y = RR * math.cos(angle)
    p.text(x, y, text=[str(tt[i])], text_align="center", text_baseline="middle", font_size="12pt", color="black")

# Add a label with a box annotation for "Bokeh Rocks" at the center of the clock
p.rect(0, 0.3, width=0.9, height=0.2, color="black", alpha=0.1)  # Background box for text
label = Label(x=0, y=0.3,  text="Bokeh Rocks", text_font_size="12pt", text_align="center", text_baseline="middle", text_color="black")
p.add_layout(label)


# Add an annular wedge around the clock (this creates a donut-like shape around the clock)
annulus = Annulus(inner_radius=0.1, outer_radius=1.1,
                             x=0, y=0, fill_color="gold", fill_alpha=0.3,
                 )
p.add_glyph(annulus)


# JavaScript callback to update the clock hands
callback = CustomJS(args=dict(hour_source=hour_source, minute_source=minute_source, second_source=second_source), code="""
    function updateClock() {
        var now = new Date();
        var hour = now.getHours() % 12 + now.getMinutes() / 60.0;
        var minute = now.getMinutes() + now.getSeconds() / 60.0;
        var second = now.getSeconds();

        var hour_angle = 2 * Math.PI * hour / 12;
        var minute_angle = 2 * Math.PI * minute / 60;
        var second_angle = 2 * Math.PI * second / 60;

        var hour_x = [0, 0.5 * Math.sin(hour_angle)];
        var hour_y = [0, 0.5 * Math.cos(hour_angle)];
        var minute_x = [0, 0.8 * Math.sin(minute_angle)];
        var minute_y = [0, 0.8 * Math.cos(minute_angle)];
        var second_x = [0, 0.9 * Math.sin(second_angle)];
        var second_y = [0, 0.9 * Math.cos(second_angle)];

        hour_source.data = {x: hour_x, y: hour_y};
        minute_source.data = {x: minute_x, y: minute_y};
        second_source.data = {x: second_x, y: second_y};
    }

    // Run the updateClock function every second
    setInterval(updateClock, 1000);

    // Call the function once to set the initial state
    updateClock();
""")

# Add periodic callback to update the clock every second
# Add plot to document and trigger animation
doc = curdoc()
doc.add_root(p)

doc.js_on_event('document_ready', callback)

# Show the plot
show(p)
