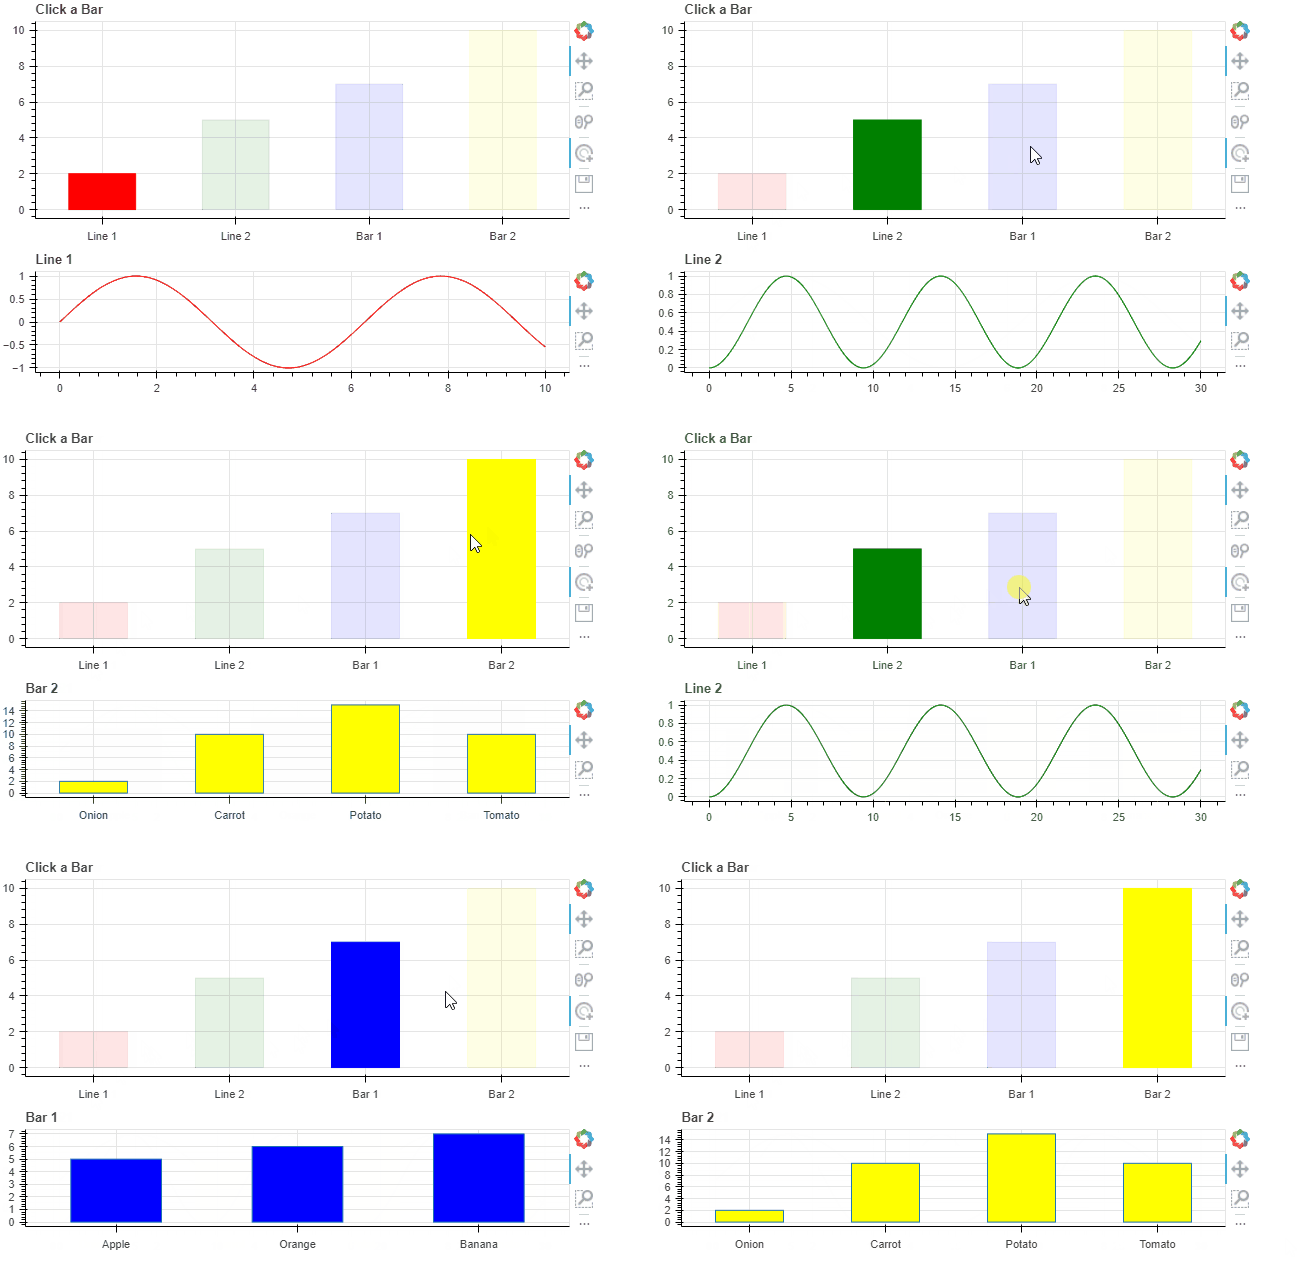
Alright, here’s a somewhat non-elegant solution. I broke the whole thing up into two different figures (one for bars with categorical x range, one for lines with numerical x range), and their visibility toggles based on the naming convention in src_dict. There is probably a way to get this all updating on one figure by instantiating FactorRange and CategoricalScale models and passing them to the callback, but this is more straightforward I think.
import numpy as np

from bokeh.plotting import figure, save
from bokeh.models import CustomJS, ColumnDataSource, TapTool
from bokeh.layouts import layout

xx = np.linspace(0,10,500)
y = np.sin(xx)
barelements = [2,5,7,10]

#create a source dictionary for each bar element based the dummy data/equations you provided
#idea is that this dictionary will get passed to CustomJS and then used to replace the data in the datsource that's plotting the lines and/or bars
src_dict = {'Line 1':{'x':xx,'y':y,}
            ,'Line 2':{'x':xx*3,'y':y**2}
            ,'Bar 1':{'x':['Apple','Orange','Banana'],'y':[5,6,7]} #new entry --> categorical data for a bar plot
            ,'Bar 2':{'x':['Onion','Carrot','Potato','Tomato'],'y':[2,10,15,10]} #new entry --> categorical data for a bar plot
            }
colors = ['red','green','blue','yellow']
color_dict = {k:colors[i] for i,k in enumerate(src_dict.keys())}

#make a columndatasource for the "main" bar plot
bar_src = ColumnDataSource({'x':list(src_dict.keys()),'y':barelements,'c':colors})

figure_barchart = figure(height=250, title="Click a Bar",x_range=list(src_dict.keys()))
main_bar_rend = figure_barchart.vbar(x='x', top='y', width=0.5, bottom=0, color='c',source=bar_src)

#now it gets different. I set this up to have two different figures, one to show lines, the other bar.
#only one of these will be visible
line_fig = figure(title='Line 1', height=150)
bar_fig = figure(title='Bar 1',height=150
                  ,x_range=src_dict['Bar 1']['x'] #initializing the x_range with Bar 1's categorical 'x'
                 )
#since we're starting with Line 1 showing, make bar_fig not visible initially
bar_fig.visible=False

#still can use on datasource, initialized with Line 1
src = ColumnDataSource(src_dict['Line 1'])
#renderer for the line on the line fig
line_rend = line_fig.line(x='x', y='y',line_color=color_dict['Line 1'],source=src)
#renderer for the bar on the bar fig
bar_rend = bar_fig.vbar(x='x',top='y',width=0.5, bottom=0, fill_color=color_dict['Bar 1'],source=src)

#create the TapTool, add it to the main bar figure, and enable it on initialization
tap = TapTool(renderers=[main_bar_rend])
figure_barchart.add_tools(tap)
figure_barchart.toolbar.active_tap = tap

#note the revised args here
cb = CustomJS(args=dict(bar_src=bar_src
                        ,line_fig=line_fig, line_rend = line_rend
                        ,bar_fig=bar_fig, bar_rend = bar_rend
                        ,src=src, src_dict=src_dict
                        ,color_dict = color_dict)
              ,code='''
              //get the index of the selected bar
              //getting 0th index cuz we just want on index value
              var sel_bar_i = bar_src.selected.indices[0]
              // what is the name associated with that index?
              var name = bar_src.data['x'][sel_bar_i]
              //now that we know that name...
              //based on your src_dict naming convention, you can flag which figure you want visible
              if (name.split(' ')[0] == 'Line'){
                      line_fig.visible = true
                      line_fig.title.text = name
                      bar_fig.visible = false
                      line_rend.glyph.line_color = color_dict[name]
                      }
              else if (name.split(' ')[0] == 'Bar'){
                  line_fig.visible = false
                  bar_fig.visible = true
                  bar_fig.title.text = name
                  bar_rend.glyph.fill_color = color_dict[name]
                  //extra piece here: update the factors on the x range to autoscale the x axis to fit the changed categorical data
                  bar_fig.x_range.factors = src_dict[name]['x']
                  }
              src.data = src_dict[name]
              src.change.emit()
              line_fig.change.emit()
              bar_fig.change.emit()
              ''')
#apply this callback to trigger whenever the indices of the selected glyph change
bar_src.selected.js_on_change('indices',cb)
lo = layout([figure_barchart,line_fig,bar_fig])

save(lo,'check.html')


 ) help me out. I’m just trying to give back by providing support for others in kind when I actually can solve their problem