Hi ![]() ,
,
I built an interactive chord diagram in Bokeh using patches and CustomJS. It supports hover highlighting for both arcs and ribbons, with a small info panel that updates dynamically.
import numpy as np
from bokeh.plotting import figure, show, output_file
from bokeh.models import HoverTool, ColumnDataSource, CustomJS, GlobalInlineStyleSheet
from bokeh.palettes import Category20
from bokeh.layouts import column, row
from bokeh.models import Div
def get_dark_stylesheet():
"""Create a new dark theme stylesheet instance."""
return GlobalInlineStyleSheet(css="""
html, body, .bk, .bk-root {
background-color: #343838;
margin: 0;
padding: 0;
height: 100%;
color: white;
font-family: 'Consolas', 'Courier New', monospace;
}
.bk { color: white; }
.bk-input, .bk-btn, .bk-select, .bk-slider-title, .bk-headers,
.bk-label, .bk-title, .bk-legend, .bk-axis-label {
color: white !important;
}
.bk-input::placeholder { color: #aaaaaa !important; }
""")
def get_light_stylesheet():
"""Create a new light theme stylesheet instance."""
return GlobalInlineStyleSheet(css="""
html, body, .bk, .bk-root {
background-color: #f3f3f3;
margin: 0;
padding: 0;
height: 100%;
color: black;
font-family: 'Consolas', 'Courier New', monospace;
}
.bk { color: black; }
.bk-input, .bk-btn, .bk-select, .bk-slider-title, .bk-headers,
.bk-label, .bk-title, .bk-legend, .bk-axis-label {
color: black !important;
}
.bk-input::placeholder { color: #555555 !important; }
""")
def create_chord_diagram(matrix, labels, colors=None, title="Chord Diagram", width=800, height=800, dark_mode=False):
"""
Create an interactive chord diagram using Bokeh.
Parameters:
-----------
matrix : 2D array-like
Square matrix representing connections between nodes
labels : list of str
Labels for each node
colors : list of str, optional
Colors for each node (hex format)
title : str
Title of the diagram
width : int
Width of the plot
height : int
Height of the plot
dark_mode : bool
Enable dark theme
Returns:
--------
bokeh.layouts.Layout
Bokeh layout containing the chord diagram
"""
n = len(labels)
matrix = np.array(matrix)
# Theme colors
if dark_mode:
bg_color = "#343838"
text_color = "white"
border_color = "#666"
info_bg = "#2a2a2a"
line_color = "#555"
else:
bg_color = "#f3f3f3"
text_color = "black"
border_color = "#333"
info_bg = "#FFF8DC"
line_color = "#CCC"
# Generate colors if not provided
if colors is None:
colors = Category20[20][:n] if n <= 20 else Category20[20] * (n // 20 + 1)
# Calculate outgoing total for each node
outgoing = matrix.sum(axis=1)
total_flow = outgoing.sum()
# Create arc positions based on outgoing flow
gap = 0.03
total_gap = gap * n
arc_positions = []
current_pos = 0
hover_state = ColumnDataSource(data=dict(active=["none"]))
for i in range(n):
arc_length = (outgoing[i] / total_flow) * (2 * np.pi - total_gap) if total_flow > 0 else 0
arc_positions.append({
'start': current_pos,
'end': current_pos + arc_length,
'mid': current_pos + arc_length / 2,
'label': labels[i],
'color': colors[i],
'value': outgoing[i]
})
current_pos += arc_length + gap
# Create plot
p = figure(width=width, height=height, title=title,
x_range=(-1.4, 1.4), y_range=(-1.4, 1.4),
toolbar_location=None, match_aspect=True)
p.axis.visible = False
p.grid.visible = False
p.outline_line_color = None
p.background_fill_color = bg_color
p.border_fill_color = bg_color
p.title.text_color = text_color
p.title.text_font = "'Consolas', 'Courier New', monospace"
p.title.text_font_size = "18pt"
# Store all ribbon renderers and data sources
ribbon_renderers = []
ribbon_sources = []
# Draw ribbons first
for i in range(n):
for j in range(n):
if i != j and matrix[i][j] > 0:
src_arc = arc_positions[i]
dst_arc = arc_positions[j]
# Calculate source position (outgoing)
offset_i = matrix[i][:j].sum()
src_start_angle = src_arc['start'] + (offset_i / outgoing[i]) * (src_arc['end'] - src_arc['start']) if outgoing[i] > 0 else src_arc['start']
src_end_angle = src_start_angle + (matrix[i][j] / outgoing[i]) * (src_arc['end'] - src_arc['start']) if outgoing[i] > 0 else src_start_angle
# Calculate destination position (incoming)
incoming_j = matrix[:, j]
offset_j = incoming_j[:i].sum()
dst_start_angle = dst_arc['start'] + (offset_j / incoming_j.sum()) * (dst_arc['end'] - dst_arc['start']) if incoming_j.sum() > 0 else dst_arc['start']
dst_end_angle = dst_start_angle + (matrix[i][j] / incoming_j.sum()) * (dst_arc['end'] - dst_arc['start']) if incoming_j.sum() > 0 else dst_start_angle
# Create ribbon with quadratic bezier curves
r = 0.85
# Source edge points
src_angles = np.linspace(src_start_angle, src_end_angle, 20)
src_x = r * np.cos(src_angles)
src_y = r * np.sin(src_angles)
# Destination edge points
dst_angles = np.linspace(dst_end_angle, dst_start_angle, 20)
dst_x = r * np.cos(dst_angles)
dst_y = r * np.sin(dst_angles)
# Create bezier curve
t = np.linspace(0, 1, 30)
src_x_end = r * np.cos(src_end_angle)
src_y_end = r * np.sin(src_end_angle)
dst_x_start = r * np.cos(dst_start_angle)
dst_y_start = r * np.sin(dst_start_angle)
curve1_x = (1-t)**2 * src_x_end + 2*(1-t)*t * 0 + t**2 * dst_x_start
curve1_y = (1-t)**2 * src_y_end + 2*(1-t)*t * 0 + t**2 * dst_y_start
dst_x_end = r * np.cos(dst_end_angle)
dst_y_end = r * np.sin(dst_end_angle)
src_x_start = r * np.cos(src_start_angle)
src_y_start = r * np.sin(src_start_angle)
curve2_x = (1-t)**2 * dst_x_end + 2*(1-t)*t * 0 + t**2 * src_x_start
curve2_y = (1-t)**2 * dst_y_end + 2*(1-t)*t * 0 + t**2 * src_y_start
# Build complete ribbon path
ribbon_x = np.concatenate([src_x, curve1_x, dst_x, curve2_x])
ribbon_y = np.concatenate([src_y, curve1_y, dst_y, curve2_y])
source = ColumnDataSource(data=dict(
x=[ribbon_x],
y=[ribbon_y],
source=[labels[i]],
target=[labels[j]],
value=[f"{matrix[i][j]:.1f}"],
source_idx=[i],
target_idx=[j]
))
source.data['alpha'] = [0.35]
ribbon = p.patches(
'x', 'y',
source=source,
fill_color=colors[i],
fill_alpha='alpha',
line_color=None
)
ribbon_renderers.append(ribbon)
ribbon_sources.append(source)
info_div = Div(
text=f"""
<div style="
padding:10px;
border:2px solid {border_color};
border-radius:6px;
background:{info_bg};
font-family:'Consolas', 'Courier New', monospace;
font-size:13px;
width:200px;
color:{text_color};
">
<b></b>
</div>
""",
width=200, margin=(-40,10,10,10)
)
# Create hover tool for ribbons
ribbon_hover = HoverTool(
renderers=ribbon_renderers,
tooltips=None,
callback=CustomJS(
args=dict(ribbons=ribbon_sources, div=info_div, state=hover_state,
border_color=border_color, info_bg=info_bg, text_color=text_color),
code="""
state.data.active[0] = "ribbon";
state.change.emit();
const r = cb_data.renderer.data_source;
const i = cb_data.index.indices[0];
if (i == null) return;
for (let k = 0; k < ribbons.length; k++) {
ribbons[k].data.alpha = [0.05];
}
r.data.alpha = [0.8];
for (let k = 0; k < ribbons.length; k++) {
ribbons[k].change.emit();
}
div.text = `
<div style="padding:10px;border:2px solid ${border_color};border-radius:6px;background:${info_bg};color:${text_color};font-family:'Consolas', 'Courier New', monospace;">
<b>From:</b> ${r.data.source[i]}<br>
<b>To:</b> ${r.data.target[i]}<br>
<b>Value:</b> ${r.data.value[i]}
</div>`;
"""
)
)
p.add_tools(ribbon_hover)
# Store all arc renderers and sources
arc_renderers = []
arc_sources = []
# Draw outer arcs
for i, arc in enumerate(arc_positions):
if arc['end'] > arc['start']:
theta = np.linspace(arc['start'], arc['end'], 100)
outer_r = 1.0
inner_r = 0.85
x_outer = outer_r * np.cos(theta)
y_outer = outer_r * np.sin(theta)
x_inner = inner_r * np.cos(theta[::-1])
y_inner = inner_r * np.sin(theta[::-1])
x_arc = np.concatenate([x_outer, x_inner])
y_arc = np.concatenate([y_outer, y_inner])
source = ColumnDataSource(data=dict(
x=[x_arc],
y=[y_arc],
label=[arc['label']],
value=[f"{arc['value']:.1f}"],
idx=[i]
))
arc_patch = p.patches('x', 'y', source=source,
fill_color=arc['color'],
fill_alpha=0.9,
line_color=line_color,
line_width=3,
hover_fill_alpha=1.0,
hover_line_width=4)
arc_renderers.append(arc_patch)
arc_sources.append(source)
# Add arc hover tool
arc_hover = HoverTool(
renderers=arc_renderers,
tooltips=None,
callback=CustomJS(
args=dict(ribbons=ribbon_sources, div=info_div,
border_color=border_color, info_bg=info_bg, text_color=text_color),
code="""
const arc_data = cb_data.renderer.data_source.data;
const arc_idx = arc_data.idx[cb_data.index.indices[0]];
if (arc_idx == null) return;
for (let k = 0; k < ribbons.length; k++) {
const src = ribbons[k].data.source_idx[0];
const tgt = ribbons[k].data.target_idx[0];
if (src === arc_idx || tgt === arc_idx) {
ribbons[k].data.alpha = [0.7];
} else {
ribbons[k].data.alpha = [0.05];
}
ribbons[k].change.emit();
}
div.text = `
<div style="padding:10px;border:2px solid ${border_color};border-radius:6px;background:${info_bg};color:${text_color};font-family:'Consolas', 'Courier New', monospace;">
<b>Node:</b> ${arc_data.label[0]}<br>
<b>Total Outgoing:</b> ${arc_data.value[0]}
</div>
`;
"""
)
)
p.add_tools(arc_hover)
# Add background click to reset
p.js_on_event('tap', CustomJS(args=dict(ribbons=ribbon_sources), code="""
for (let k = 0; k < ribbons.length; k++) {
ribbons[k].data['alpha'] = [0.35];
ribbons[k].change.emit();
}
"""))
# Reset on mouse leave
p.js_on_event('mouseleave', CustomJS(
args=dict(ribbons=ribbon_sources, div=info_div,
border_color=border_color, info_bg=info_bg, text_color=text_color),
code="""
for (let k = 0; k < ribbons.length; k++) {
ribbons[k].data.alpha = [0.35];
ribbons[k].change.emit();
}
div.text = `
<div style="
padding:10px;
border:2px solid ${border_color};
border-radius:6px;
background:${info_bg};
font-family:'Consolas', 'Courier New', monospace;
font-size:13px;
width:200px;
color:${text_color};
">
<b>Hover over a ribbon or arc</b>
</div>
`;
"""
))
# Add labels outside the circle
for arc in arc_positions:
if arc['end'] > arc['start']:
label_r = 1.18
label_x = label_r * np.cos(arc['mid'])
label_y = label_r * np.sin(arc['mid'])
angle = arc['mid'] % (2 * np.pi)
if 0 <= angle < np.pi/2 or 3*np.pi/2 <= angle < 2*np.pi:
align = 'left'
else:
align = 'right'
p.text(x=[label_x], y=[label_y], text=[arc['label']],
text_align=align, text_baseline='middle',
text_font_size='13pt', text_font_style='bold',
text_color=text_color)
return column(p, info_div)
##########################
# EXAMPLES
##########################
#-------1--------------
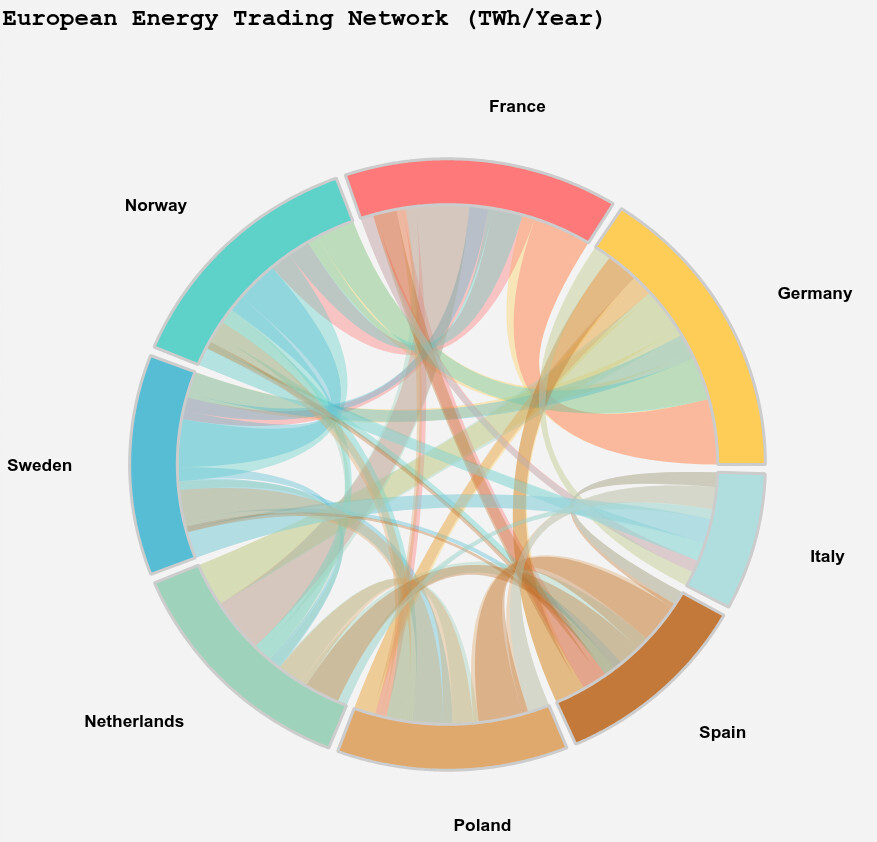
output_file("chord_light_energy.html")
# Data represents TWh (terawatt-hours) traded annually
matrix_energy = [
[0, 45, 32, 18, 28, 15, 22, 12], # Germany
[38, 0, 28, 15, 35, 8, 18, 10], # France
[25, 22, 0, 42, 12, 18, 8, 15], # Norway
[15, 12, 38, 0, 8, 28, 6, 20], # Sweden
[30, 40, 10, 6, 0, 18, 25, 8], # Netherlands
[12, 6, 15, 25, 20, 0, 32, 18], # Poland
[18, 15, 5, 4, 22, 35, 0, 12], # Spain
[10, 8, 12, 18, 6, 15, 10, 0] # Italy
]
labels_energy = ['Germany', 'France', 'Norway', 'Sweden',
'Netherlands', 'Poland', 'Spain', 'Italy']
colors_energy = ['#FFC947', '#FF6B6B', '#4ECDC4', '#45B7D1',
'#96CEB4', '#DDA15E', '#BC6C25', '#A8DADC']
diagram_energy = create_chord_diagram(
matrix_energy, labels_energy, colors_energy,
title="European Energy Trading Network (TWh/Year)",
dark_mode=False,
width=900, height=900
)
# Apply light stylesheet
light_sheet = get_light_stylesheet()
diagram_energy.stylesheets = [light_sheet]
show(diagram_energy)
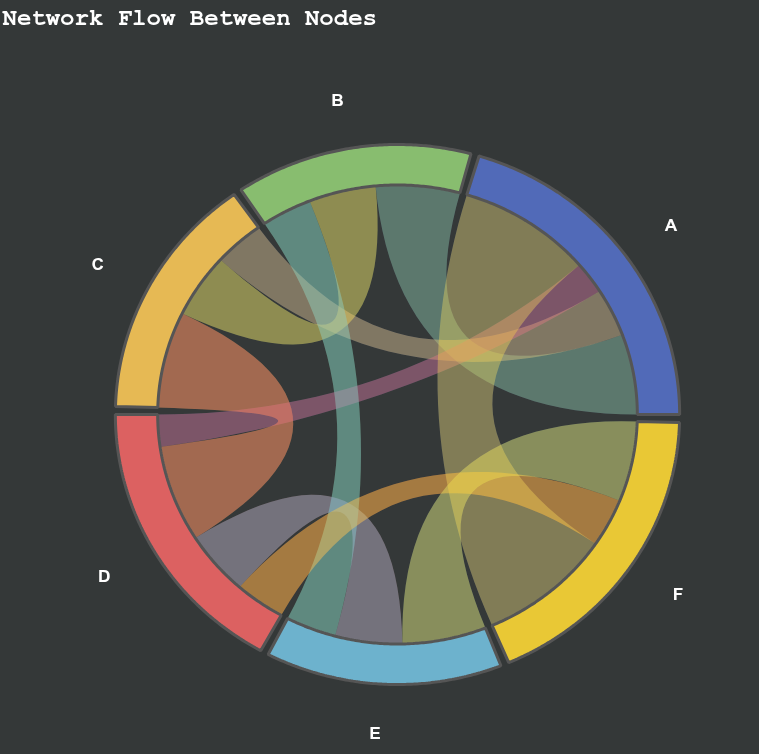
#-------------2--------------
output_file("chord_example2.html")
matrix1 = [
[0, 5, 3, 2, 0, 8],
[5, 0, 4, 0, 3, 0],
[3, 4, 0, 6, 0, 0],
[2, 0, 6, 0, 4, 3],
[0, 3, 0, 4, 0, 5],
[8, 0, 0, 3, 5, 0]
]
labels1 = ['A', 'B', 'C', 'D', 'E', 'F']
colors1 = ['#5470C6', '#91CC75', '#FAC858', '#EE6666', '#73C0DE', '#FDD835']
diagram1 = create_chord_diagram(matrix1, labels1, colors1, dark_mode=True,
title="Network Flow Between Nodes")
dark_sheet = get_dark_stylesheet()
diagram1.stylesheets = [dark_sheet]
show(diagram1)