import numpy as np
import pandas as pd
from bokeh.plotting import figure, curdoc
from bokeh.models import ColumnDataSource, Div, GlobalInlineStyleSheet
from bokeh.layouts import column
from bokeh.transform import linear_cmap
from matplotlib import cm
from matplotlib.colors import to_hex
import math
rdblue = [to_hex(cm.get_cmap('RdYlBu_r')(i/255)) for i in range(256)]
gstyle = GlobalInlineStyleSheet(css=""" html, body, .bk, .bk-root {background-color: #343838; margin: 0; padding: 0; height: 100%; color: white; font-family: 'Consolas', 'Courier New', monospace; } .bk { color: white; } .bk-input, .bk-btn, .bk-select, .bk-slider-title, .bk-headers, .bk-label, .bk-title, .bk-legend, .bk-axis-label { color: white !important; } .bk-input::placeholder { color: #aaaaaa !important; } """)
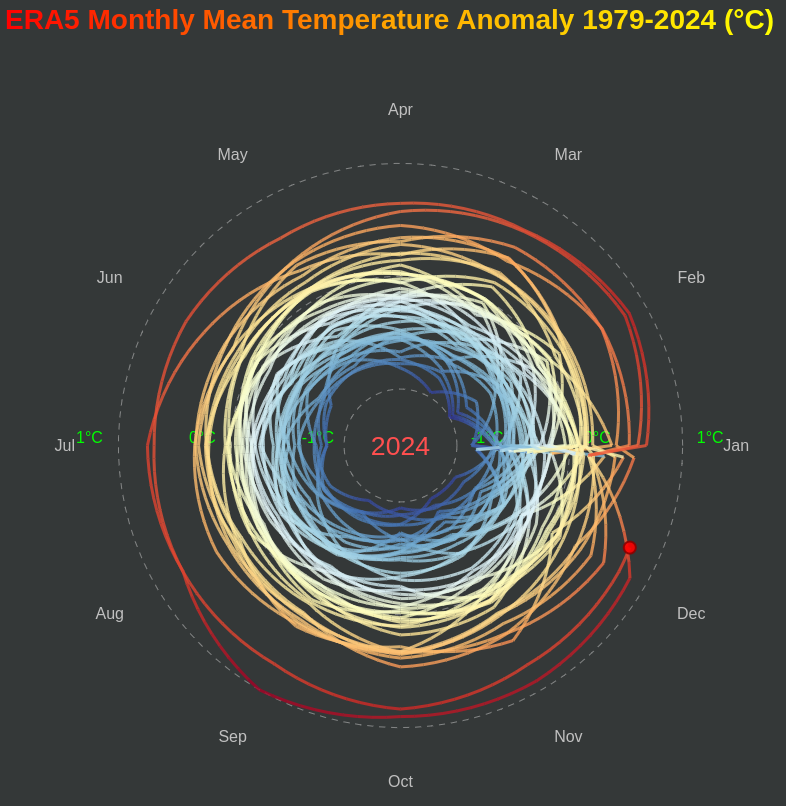
# Generate random temperature data with smooth interpolation instead of ERA5 data !!!
np.random.seed(42)
years = list(range(1979, 2025))
months = ['Jan', 'Feb', 'Mar', 'Apr', 'May', 'Jun',
'Jul', 'Aug', 'Sep', 'Oct', 'Nov', 'Dec']
# Create seasonal temperature pattern with random variation
base_temps = [12,15, 12, 18, 24, 18, 30, 29, 15, 18, 10, 4] # Seasonal pattern
temp_data = []
for year in years:
year_temps = []
for i, month in enumerate(months):
# Add random variation and slight warming trend over years
temp_variation = np.random.normal(0, 3)
warming_trend = (year - 1979) * 0.2 # Slight warming over time
temp = base_temps[i] + temp_variation + warming_trend
year_temps.append(temp)
temp_data.append(year_temps)
# Create smooth spiral data with more points per year
points_per_year = 120
df_data = []
for i, year in enumerate(years):
year_temps = temp_data[i]
# Create smooth interpolation within the year
for j in range(points_per_year):
progress = j / points_per_year # 0 to 1 progress through the year
angle = progress * 2 * math.pi # Full circle
# Smooth temperature interpolation
month_float = progress * 12
month_index = int(month_float) % 12
month_fraction = month_float - int(month_float)
# Interpolate between current and next month's temperature
current_temp = year_temps[month_index]
next_temp = year_temps[(month_index + 1) % 12]
temperature = current_temp + (next_temp - current_temp) * month_fraction
df_data.append({
'year': year,
'temperature': temperature,
'angle': angle,
'year_progress': i + progress
})
df = pd.DataFrame(df_data)
# Normalize temperature for radius and create color mapping based on radius
min_temp, max_temp = df['temperature'].min(), df['temperature'].max()
inner_radius, outer_radius = 20, 100
df['radius'] = inner_radius + (df['temperature'] - min_temp) / (max_temp - min_temp) * (outer_radius - inner_radius)
# Convert polar to cartesian coordinates
df['x'] = df['radius'] * np.cos(df['angle'])
df['y'] = df['radius'] * np.sin(df['angle'])
# Create figure centered at origin
p = figure(width=800, height=800,
toolbar_location=None, match_aspect=True,
x_range=(-140, 140), y_range=(-140, 140), background_fill_color="#343838",
border_fill_color="#343838", outline_line_color="#343838",)
# Remove axes and grid
p.axis.visible = False
p.grid.visible = False
p.grid.grid_line_color = "gray"
p.grid.grid_line_alpha = 0.3
p.xaxis.visible = False
p.yaxis.visible = False
# Create month labels around the circle
month_angles = [i * (2 * math.pi / 12) for i in range(12)]
month_radius = outer_radius + 19
month_x = [month_radius * math.cos(angle) for angle in month_angles]
month_y = [month_radius * math.sin(angle) for angle in month_angles]
# Add month labels
for i, month in enumerate(months):
p.text([month_x[i]], [month_y[i]], text=[month],
text_align="center", text_baseline="middle", text_font_size="12pt",text_color="silver")
# Create concentric circles for temperature reference
temp_circles = [inner_radius, (inner_radius + outer_radius)/2, outer_radius]
temp_labels = [f"{min_temp:.0f}°C", f"{(min_temp + max_temp)/2:.0f}°C", f"{max_temp:.0f}°C"]
for i, radius in enumerate(temp_circles):
circle_x = [radius * math.cos(angle) for angle in np.linspace(0, 2*math.pi, 100)]
circle_y = [radius * math.sin(angle) for angle in np.linspace(0, 2*math.pi, 100)]
p.line(circle_x, circle_y, line_color="lightgray", line_alpha=0.5, line_dash="dashed")
# Add temperature labels
p.text([radius + 5], [0], text=[temp_labels[i]],
text_font_size="12pt", text_color="lime")
p.text([-radius - 15], [0], text=[temp_labels[i]],
text_font_size="12pt", text_color="lime")
# Create data sources
current_point_source = ColumnDataSource(data=dict(x=[], y=[], temperature=[]))
year_source = ColumnDataSource(data=dict(year_text=["1979"]))
# Add spiral line - we'll use segments for color mapping
from bokeh.models import LinearColorMapper
from bokeh.transform import transform
# Create color mapper based on radius (blue inside, red outside)
color_mapper = LinearColorMapper(palette=rdblue, low=inner_radius, high=outer_radius)
# We'll create line segments instead of a continuous line for color mapping
segment_source = ColumnDataSource(data=dict(x0=[], y0=[], x1=[], y1=[], radius=[]))
spiral_segments = p.segment('x0', 'y0', 'x1', 'y1', source=segment_source,
line_width=3, line_alpha=0.8,
line_color=transform('radius', color_mapper))
# Add current position marker
current_marker = p.circle('x', 'y', source=current_point_source, size=12,
color='red', alpha=0.9, line_color='darkred', line_width=2)
# Animation variables
current_index = 0
animation_speed = 1
from bokeh.models import Label
# Create a Label for the year, initially at the center (0,0)
year_label = Label(x=0, y=0, text="1979",
text_font_size="20pt", text_color="#FF4F4F",
text_align="center", text_baseline="middle",
background_fill_color=None)
p.add_layout(year_label)
def animate():
global current_index
if current_index < len(df):
# Get data up to current point
current_data = df.iloc[:current_index + 1]
# Create line segments for color mapping
if len(current_data) > 1:
x0_vals = current_data['x'].iloc[:-1].tolist()
y0_vals = current_data['y'].iloc[:-1].tolist()
x1_vals = current_data['x'].iloc[1:].tolist()
y1_vals = current_data['y'].iloc[1:].tolist()
radius_vals = current_data['radius'].iloc[1:].tolist() # Use radius for coloring
# Update spiral segments
segment_source.data = {
'x0': x0_vals,
'y0': y0_vals,
'x1': x1_vals,
'y1': y1_vals,
'radius': radius_vals
}
# Update current position marker
current_point = df.iloc[current_index]
current_point_source.data = {
'x': [current_point['x']],
'y': [current_point['y']],
'temperature': [current_point['temperature']]
}
# Update year display
current_year = current_point['year']
year_label.text = f"{int(current_year)}"
current_index += 1
# Reset animation when complete
if current_index >= len(df):
current_index = 0
# Add animation callback
curdoc().add_periodic_callback(animate, animation_speed)
gradient_text = """
<div style="
font-size: 28px;
font-weight: bold;
background: linear-gradient(90deg, red, orange, yellow);
-webkit-background-clip: text;
-webkit-text-fill-color: transparent;
background-clip: text;
color: transparent;
">
ERA5 Monthly Mean Temperature Anomaly 1979-2024 (°C)
</div>
"""
divinfo = Div(text = gradient_text)
# Create layout
layout = column(divinfo, p, sizing_mode="scale_width",stylesheets = [gstyle])
curdoc().add_root(layout)
curdoc().title = "ERA5 Temperature Anomaly at 2 m"
# Initial call to set up the plot
animate()
bokeh serve --show app.py