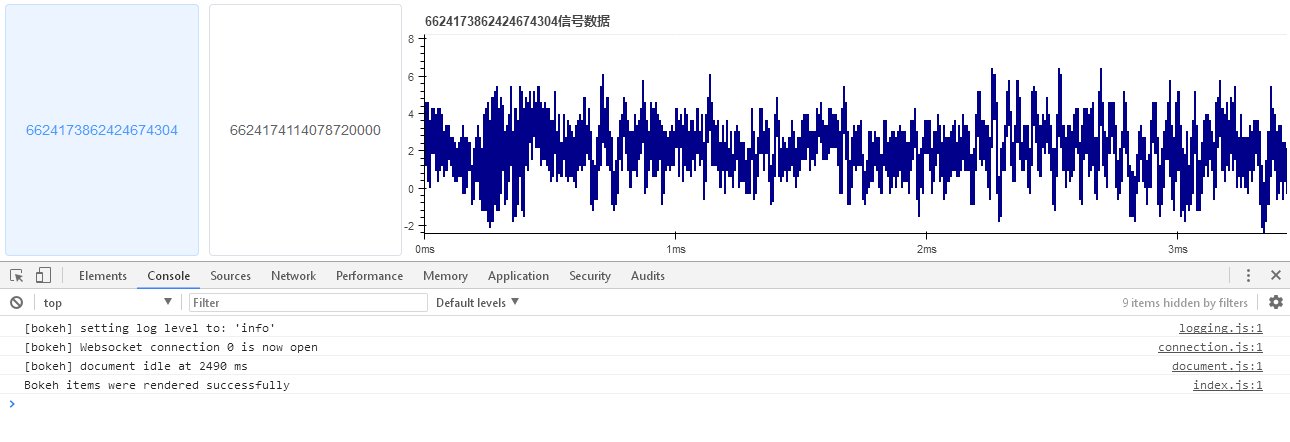
I Embedded bokeh in Django, and the code is as follows
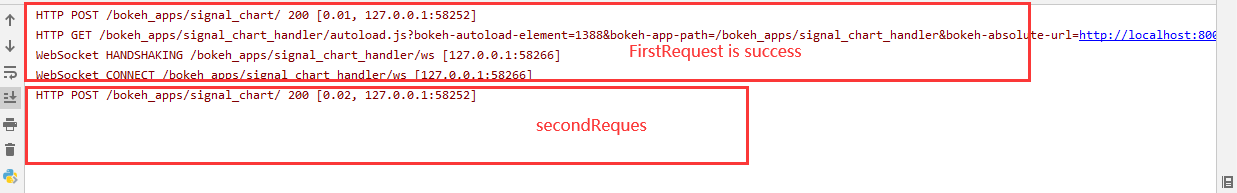
Pass the variable wriid through the Ajax request in HTML file of another server. At present, the first request is normal, but when I change the passed variable wirid, the graph is not rendered. What should I do with this one? Can’t the third party respond in HTML?
from os.path import join
from pathlib import Path
import bokeh.plotting as bp
from bokeh.embed import server_document
from bokeh.layouts import column
from bokeh.models import HoverTool, CustomJS, ColumnDataSource, Button, TextInput
from bokeh.themes import Theme
from bokeh.document import Document
from django.http import HttpRequest, HttpResponse
import datashader as ds
import pandas as pd
import numpy as np
import datashader.transfer_functions as tf
from django.shortcuts import render
from datashader.bokeh_ext import InteractiveImage
from utils import matUtil, jsonUtil
from web.CustomModelBackends import token_required_url, token_required
from ykkj_ai import settings
def signal_chart_handler(doc: Document) -> None:
# 通过请求参数查找信号存储文件
args = doc.session_context.request.arguments
theme = Theme(filename=join(settings.THEMES_DIR, "theme.yaml"))
data = matUtil.loadmat(Path(join(settings.BASE_DIR, "featrue_bokeh", args.get("wriId") + ".mat")))["data"]
# 悬停工具
hover = HoverTool(
tooltips=[
("(x值,y值)", "($x, $y)"),
]
)
# 处理信号数据并封装
p = bp.figure(x_axis_type="datetime", x_range=(0, 5), title=args.get("wriId")+"信号数据",
tools=[hover, 'pan', 'wheel_zoom', 'box_zoom', 'save', 'reset'],
y_range=(np.min(data), np.max(data)))
dists = {cat: pd.DataFrame(dict(x=np.arange(0, len(data), 1) / float(44100),
y=data,
val=val, cat=cat))
for x, y, s, val, cat in
[(2, 2, 0.01, 10, "d1")]}
df = pd.concat(dists, ignore_index=True)
df["cat"] = df["cat"].astype("category")
width, height = p.plot_width, p.plot_height
xmin, xmax = p.x_range.start, p.x_range.end
ymin, ymax = p.y_range.start, p.y_range.end
x_range = (xmin, xmax)
y_range = (ymin, ymax)
dw, dh = xmax - xmin, ymax - ymin
cvs = ds.Canvas(plot_width=width, plot_height=height, x_range=x_range, y_range=y_range)
agg = cvs.line(df, 'x', 'y') # , ds.count())
img_agg = tf.shade(agg, min_alpha=255)
image = tf.dynspread(img_agg, threshold=0.25, max_px=1)
source = ColumnDataSource(data=dict(image=[image.data], x=[xmin],
y=[ymin], dw=[dw], dh=[dh]))
p.image_rgba(source=source, image='image', x='x', y='y',
dw='dw', dh='dh', dilate=False)
# 处理各种回调
p.x_range.callback = CustomJS(code="""
debugger;
""")
# 准备推送到客户端
doc.theme = theme
doc.add_root(column(p, sizing_mode='stretch_both'))
doc.title = args.get("wriId")+"信号数据"
#请求参数wriId:采集信号时的主键
@token_required('ROLE_ADMIN')
def signal_chart_main(request: HttpRequest) -> HttpResponse:
script = server_document(
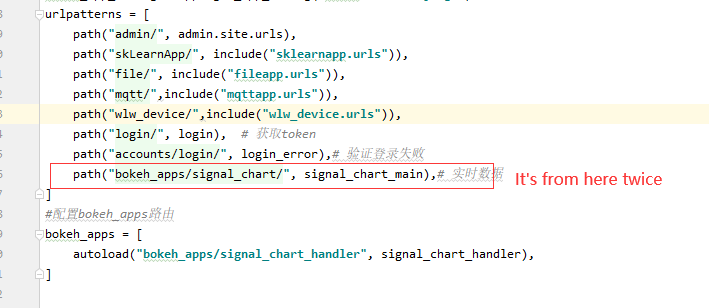
url=request._current_scheme_host + '/bokeh_apps/signal_chart', # 此处配置与bokeh_apps.autoload中请求地址保持一致
arguments=dict(request.GET.dict(), **request.POST.dict()) # bokeh只接受不带参数的url因此处理django参数,处理django参数数据
)
# 前后端分离,前端执行返回的script即可实现数据渲染
return jsonUtil.http_response_success(script)