The former. xy coords of the drawn rectangle in the plotted image axes coordinates. Can be a top left vertex and width,height or two opposite vertices. I plot the image this way:
source = ColumnDataSource({'image': [samples[0]]})
fig = figure(x_axis_label='X [px]',
y_axis_label='Y [px]',
tooltips=TOOLTIPS,
tools=tools)
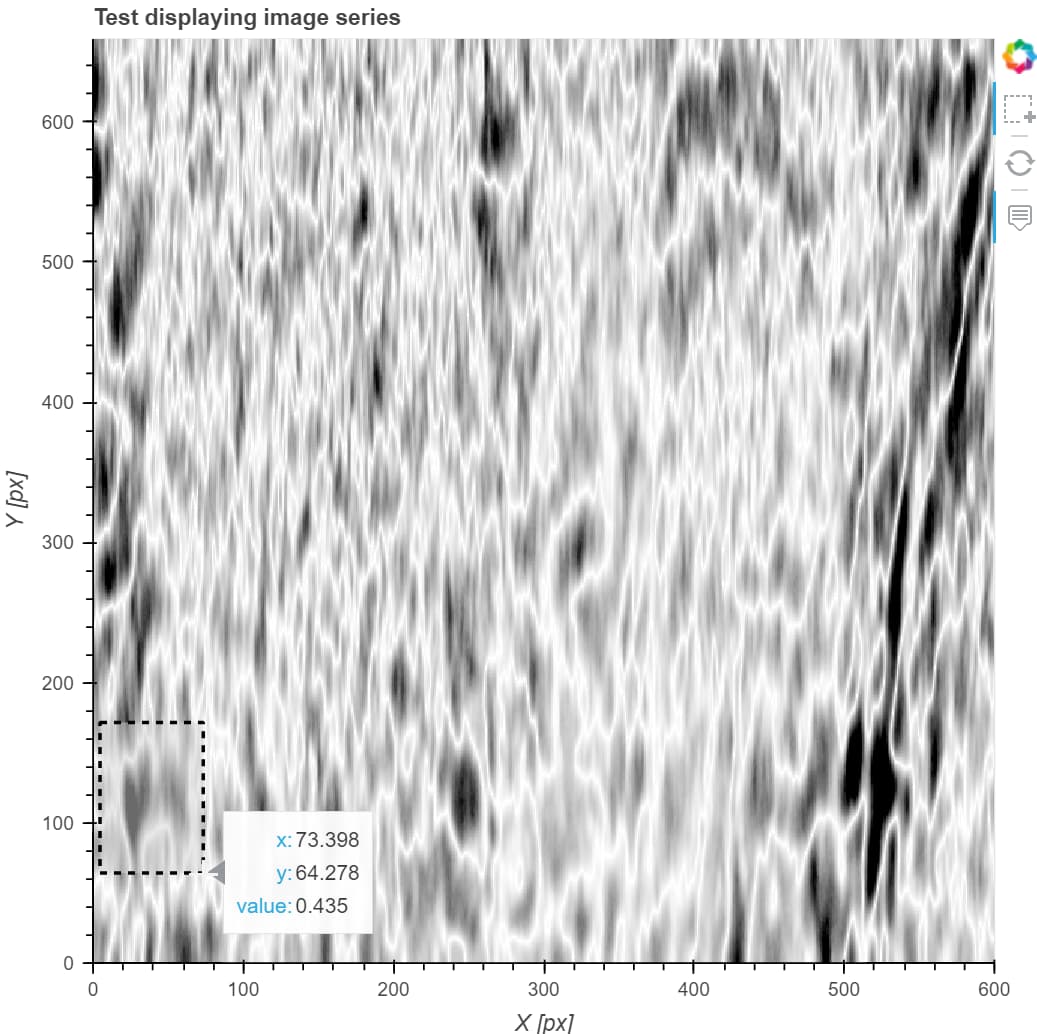
im = fig.image(source=source, x=0, y=0, dw=600, dh=659)
where “samples” is just a list of 2D numpy arrays and my image arrays have dimensions of dw and dh pixels (here, 659 x 600 px).
At your linked topic, I see a SelectionGeometry mentionned but I don’t see how this can be used in combination with the BoxSelectTool.
As a simple workaround, I have used the Tap event which directly gives the clicked point in the x,y axes coordinates. Doing it twice can give me a rectangle but that’s not great. Then I round them up to integers and I can use them to work with my image array.
    def callback_tap(event):
        coords=(event.x,event.y)
        print(coords)
    fig.on_event(Tap, callback_tap)