Hi everyone!
I’ve been using Bokeh for a while now and I’ve been very happy with it’s customizability and speed. A new requirement has come up in quite a complex existing project and I would be very happy to be able to implement the changes without a complete overhaul of the data and structure.
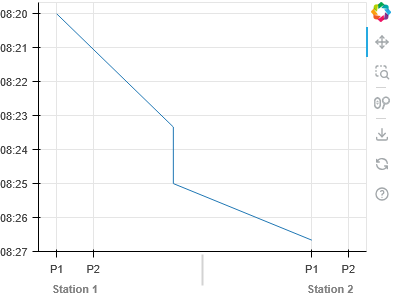
For context, I am using bokeh to visualize the movement of trains in a railway network. The x-axis contains two-level categorical data with the stations being the first level and the platforms being the second level. The y-axis is a datetime axis. Now, I want to model delays and stoppages at specific points in between two stations. So an example of what I want to do would look something like this:
Now, I’m using a FactorRange to define my x_range. If I understand it correctly, the FactorRange is converted to a numerical synthetic coordinate range under the hood. However, the mapping is managed on the JS side, correct?
I need to access specific points in between two of my x-coordinates. For example, I would like to get the x-coordinates of a point that is 40% of the way between (Station 1, Platform 1) and (Station 2, Platform 1). I’ve found a very hacky way to do this using offsets that makes a lot of assumptions about the mapping of multi-level-categories and the padding of my FactorRange. This seems to be very error-prone and tends to fall apart if the two stations are not direct neighbours on the x-axis. Is there any way I can achieve this in a more robust manner, for example by somehow accessing the synthetic coordinate mapping on the Python side? I’ve attached a minimal code example with some comments about what I would like to do.
Thanks in advance for your help!
EDIT: I just realized something I should add: In the project I am talking about I’m running a bokeh server by manually creating and starting a Tornado IOLoop from the code that receives updates in real-time. So in theory some type of bidirectional communication between the Python and JS sides should be possible.
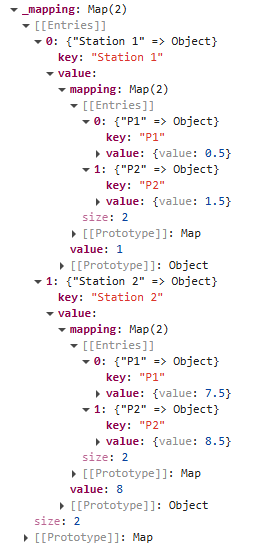
EDIT2: I’ve been digging through the JS source for a bit and it turns out that the FactorMapper’s mapping attribute seems to be exactly what I’m looking for. There is no simple way to access it from the Python side of things without changing both the JS and Python source, is there? ![]()
from bokeh.plotting import figure, show
from bokeh.models import ColumnDataSource, FactorRange
from bokeh.models.formatters import DatetimeTickFormatter

x_range = [("Station 1", "P1"), ("Station 1", "P2"), ("Station 2", "P1"), ("Station 2", "P2")]
x_values = [("Station 1", "P1"), ("Station 2", "P1")]
y_values = [30000000, 30300000]
cds_dict = {"x": x_values,
            "y": y_values}

#Here I would like to do something like the following
#x1_synth_coords = x_synth_mapping[("Station 1", "P1")]
#x2_synth_coords = x_synth_mapping[("Station 2", "P1")]
#x_between = interpolate(x1_synth_coords, x2_synth_coords, 0.4)
#x_values = [("Station 1", "P1"), x_between, x_between, ("Station 2", "P1")
#y_values = [30000000, 30200000, 30300000, 30400000]

source = ColumnDataSource(data=cds_dict)

p=figure(x_range=FactorRange(*x_range, group_padding=5), y_axis_type="datetime", width=400, height=300)
p.y_range.flipped = True
p.yaxis.formatter = DatetimeTickFormatter(minutes='%H:%M')

p.line(x="x", y="y", source=source)
show(p)