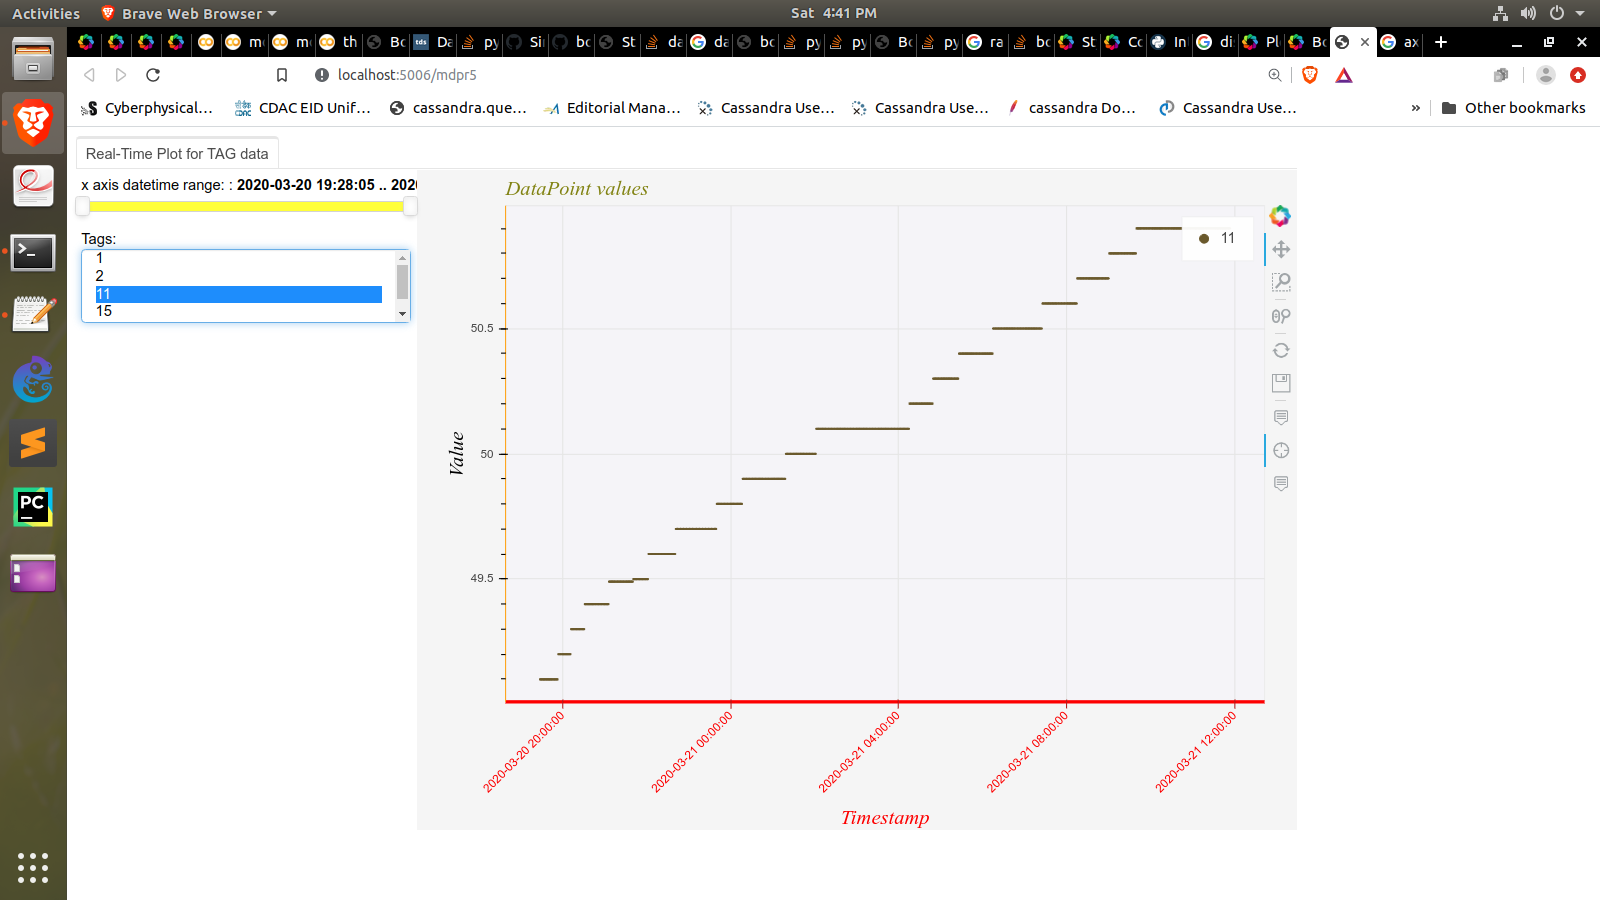
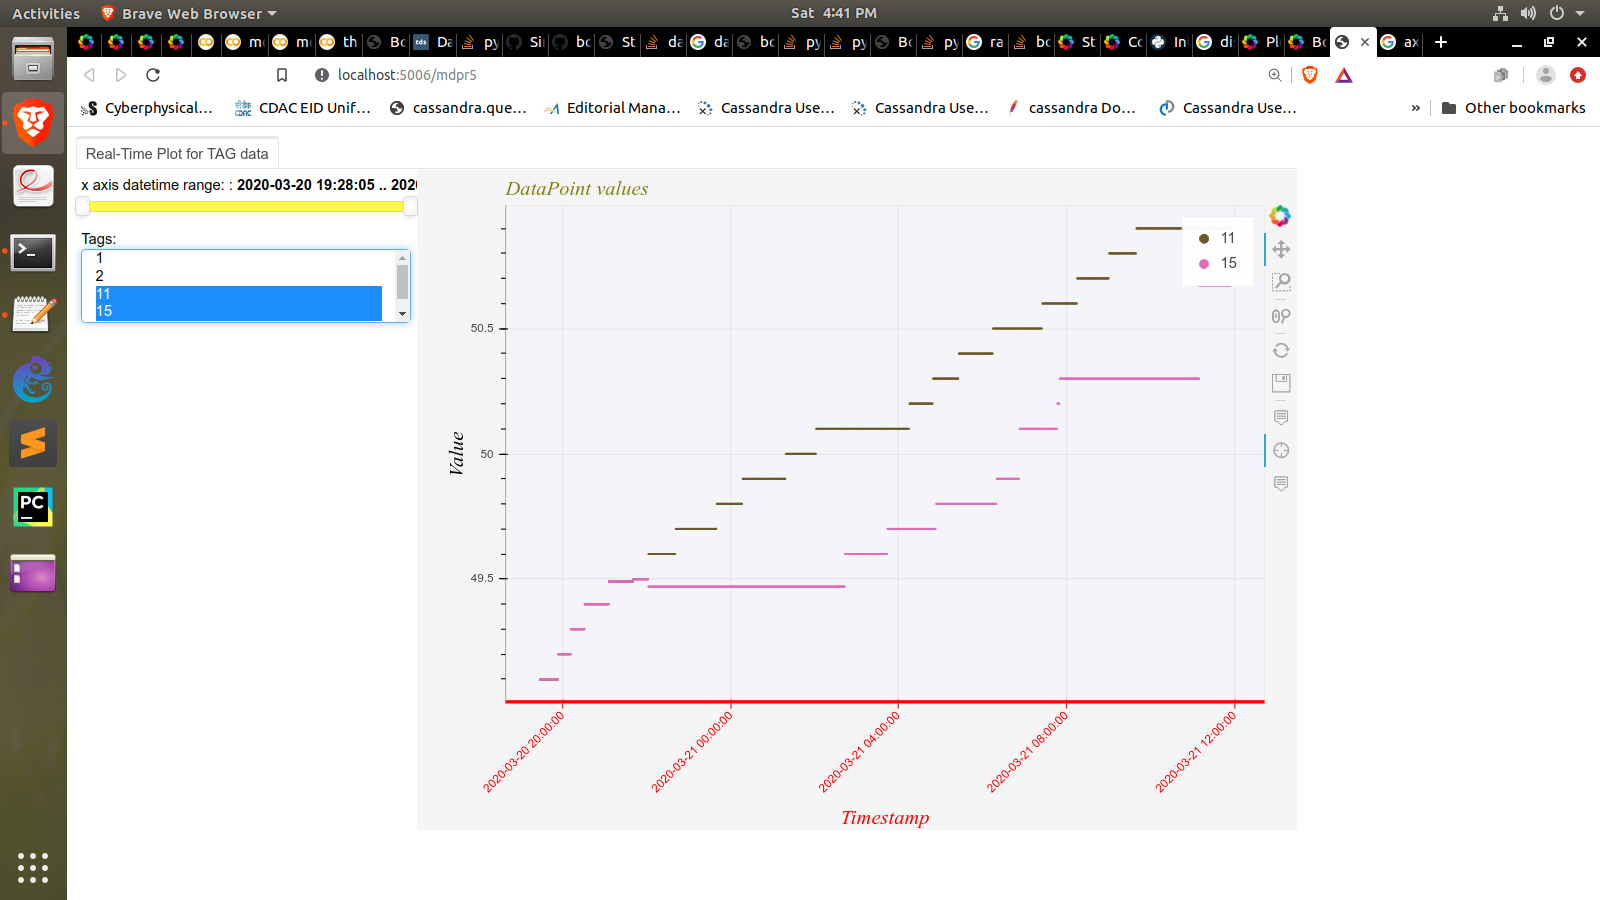
As shown in the following set of figures, I add a line (actually scatter) for each Tag selected on the MultiSelect widget with different colour and same X and Y axes. I am simply doing it by modifying the columndatasource on change in the Select input as shown in the code below.
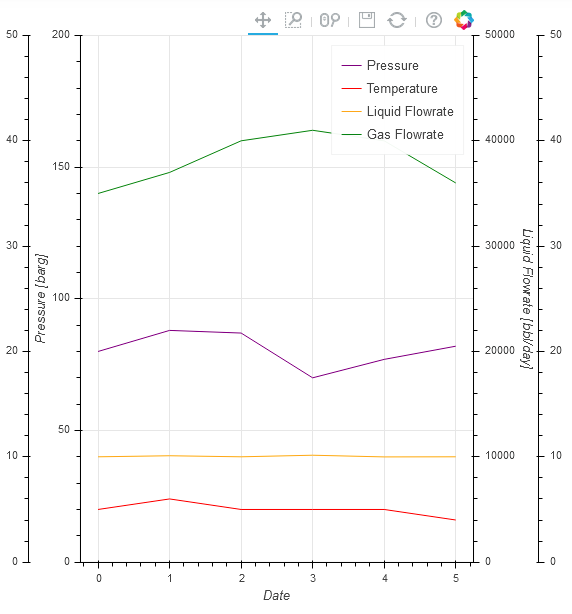
But what I want is to add (remove) extra y axis for each Tag selected on the widget, (something like in the 3rd figure). Please some one help me how to do that.
Here is my code:
import io
from math import pi
import requests
import pandas as pd
import datetime
from datetime import date
import numpy as np
from pytz import timezone

from bokeh.models import ColumnDataSource, HoverTool, SaveTool, MultiSelect, RadioGroup, Select, Panel, Tabs
from bokeh.models.formatters import DatetimeTickFormatter
from bokeh.models.widgets import TextInput, Button, DateRangeSlider
from bokeh.plotting import figure, curdoc, output_notebook, output_file, show
from bokeh.layouts import row, widgetbox, layout, column


output_notebook()
import random
r = lambda: random.randint(0,255)

dcu_data = pd.read_csv('/home/superusr/Desktop/colaboratory_python/dcu_data.csv')

dcu_data.sort_values("TAGID", ascending = True, inplace = True)
dcu_data['TAGDATETIME'] = pd.to_datetime(dcu_data['TAGDATETIME'])
dcu_data['Disp_TAGDATETIME'] = dcu_data['TAGDATETIME'].dt.strftime("%Y-%m-%d %H:%M:%S")

available_tags = list(dcu_data['TAGID'].unique())
available_tags.sort()

dcu_data['color']=np.nan
for i in available_tags:
	colour=('#%02X%02X%02X' % (r(),r(),r()))
	dcu_data.loc[dcu_data['TAGID'] == i, ['color']] = colour

tag_list = [str(x) for x in available_tags]
curTag=['{0}'.format(available_tags[0])]
curTag = list(map(int, curTag))
# print(curTag)
tag_data=dcu_data[dcu_data['TAGID'].isin(curTag)]
tag_data.sort_values("TAGDATETIME", ascending = True, inplace = True)

start_time=tag_data['TAGDATETIME'].iloc[-0]
end_time=tag_data['TAGDATETIME'].iloc[-1]

source=ColumnDataSource(tag_data)

p = figure(x_axis_type="datetime", plot_width=800, plot_height=600, title = 'DataPoint values',
      x_axis_label = 'Timestamp', y_axis_label = 'Value',
      tools = ['hover','box_zoom','wheel_zoom', 'pan','reset', 'save', 'crosshair'],
      toolbar_location="right")

def make_plot(source):

  graph1=p.circle(x='TAGDATETIME', y='TAGVALUE', line_color = 'color',
		source=source, legend = 'TAGID', fill_color='color', hover_fill_color = 'color', size=1)
  hover = HoverTool(tooltips = [('Timestamp', '@Disp_TAGDATETIME'),
              ('Tagtype', '@TAGTYPE'),
              ('TagId', '@TAGID'),
              ('Value', '@TAGVALUE')], mode = 'vline')

  p.add_tools(hover)

  p.xaxis.formatter=DatetimeTickFormatter(
    hours=["%Y-%m-%d %H:%M:%S"],
    days=["%Y-%m-%d %H:%M:%S"],
    months=["%Y-%m-%d %H:%M:%S"],
    years=["%Y-%m-%d %H:%M:%S"],
  )


  p.background_fill_color = "#ebe9f2" #"beige"
  p.background_fill_alpha = 0.5

  p.border_fill_color = "whitesmoke"
  p.min_border_left = 80

  p.title.text_color = "olive"
  p.title.text_font = "times"
  p.title.text_font_style = "italic"
  p.title.align = 'left'
  p.title.text_font_size = '14pt'

  p.xaxis.major_label_orientation = pi/4
  p.xaxis.axis_line_width = 3
  p.xaxis.axis_line_color = "red"
  p.xaxis.major_label_text_color = "red"
  p.yaxis.axis_line_color = "orange"


  p.xaxis.major_tick_line_color = "firebrick"
  p.xaxis.minor_tick_line_color = "orange"


  p.xaxis.axis_label_text_font = 'times'
  p.yaxis.axis_label_text_font = 'times'
  p.xaxis.axis_label_text_font_style = 'italic'
  p.yaxis.axis_label_text_font_style = 'italic'
  p.xaxis.axis_label_text_color = 'red'
  p.yaxis.axis_label_text_color = 'black'

  p.xaxis.axis_label_text_font_size = '14pt'
  p.xaxis.major_label_text_font_size = '8pt'
  p.yaxis.axis_label_text_font_size = '14pt'
  p.yaxis.major_label_text_font_size = '8pt'

  return p

def getLiveData(lastTimeStamp):
  global dcu_data

  df_liveData=pd.DataFrame({'TAGID': [1, 2, 11, 15, 25],
                            'TELEGRAMNO': [1, 2, 11, 15, 25],
                            'METERID': [1, 1, 1, 1, 1],
                            'DCUID': [1, 1, 1, 1, 1],
                            'TAGTYPE': [12, 12, 10, 10, 10],
                            'TAGVALUE': [230.75, 228.70, 49.84, 50.01, 50.63],
                            'UNIT': [38, 38, 35, 35, 35],
                            'TAGDATETIME': ['2020-03-22 00:01:00', '2020-03-22 00:02:00', '2020-03-22 00:03:00', '2020-03-22 00:04:00', '2020-03-22 00:05:00'],
                            'TIMEBLOCK': [1, 1, 1, 1, 1],
			    'color':[0,0,0,0,0]})
  df_liveData['TAGDATETIME'] = pd.to_datetime(df_liveData['TAGDATETIME'])
  df_liveData['Disp_TAGDATETIME'] = df_liveData['TAGDATETIME'].dt.strftime("%Y-%m-%d %H:%M:%S")
  dcu_data.append(df_liveData, ignore_index = True)
  #print(dcu_data.head())
  return df_liveData


def getNewTagDataset(curTag, start_time, end_time):
  tag_data=dcu_data[dcu_data['TAGID'].isin(curTag)]
  tag_data=tag_data[tag_data['TAGDATETIME']>=start_time]
  tag_data=tag_data[tag_data['TAGDATETIME']<=end_time]
  newSource=ColumnDataSource(tag_data)
  return newSource;

def tag_select_handler(attr, old, new):
  curTag=[i for i in tag_select.value]
  curTag = list(map(int, curTag))
  new_src = getNewTagDataset(curTag, start_time, end_time)
  source.data.update(new_src.data)
  return

def date_range_update(attrname, old, new):
  global start_time
  global end_time

  range_dt = list(date_range_slider.value)
  st="{0}".format(range_dt[0])
  et="{0}".format(range_dt[1])

  st=int(st)/1000.0
  et=int(et)/1000.0

  st=datetime.datetime.utcfromtimestamp(st).strftime('%Y-%m-%d %H:%M:%S')
  et=datetime.datetime.utcfromtimestamp(et).strftime('%Y-%m-%d %H:%M:%S')


  start_time=pd.to_datetime(st)
  end_time=pd.to_datetime(et)

  new_src=tag_data[tag_data['TAGDATETIME']>=start_time]
  new_src=new_src[new_src['TAGDATETIME']<=end_time]

  newSource=ColumnDataSource(new_src)
  source.data.update(newSource.data)
  return


date_range_slider = DateRangeSlider(title="datetime range: ",orientation='horizontal', start=start_time, end=end_time, value=(start_time, end_time), step=1, format="%Y-%m-%d %H:%M:%S", width=300, bar_color='yellow', align='start')
date_range_slider.on_change('value', date_range_update)

tag_select = MultiSelect(title="Tags:", value=['{0}'.format(tag_list[0])], options=tag_list)  #where value='line' says initial option selected by default
tag_select.on_change("value", tag_select_handler)
curTag=[i for i in tag_select.value]
curTag = list(map(int, curTag))


range_dt = list(date_range_slider.value)
st="{0}".format(range_dt[0])
et="{0}".format(range_dt[1])
start_time=pd.to_datetime(st)
end_time=pd.to_datetime(et)


source = getNewTagDataset(curTag, start_time, end_time)
p = make_plot(source)

layout = row(column(date_range_slider,tag_select), p)
tab = Panel(child=layout, title='Real-Time Plot for TAG data')
tabs = Tabs(tabs=[tab])
curdoc().add_root(tabs)