Hi,
Trying to understand how add_layout works with legends outside the plot.
I have figures that are vertically long, but narrow, which means I need to have the legends outside the plot. However I observe that legends, also added to neighbor plots with add_layout, are affected by the location of the legends to the first plot.
In the code below:
-
Plot x1, x2, x3 in p1
-
Plot x4 in p2
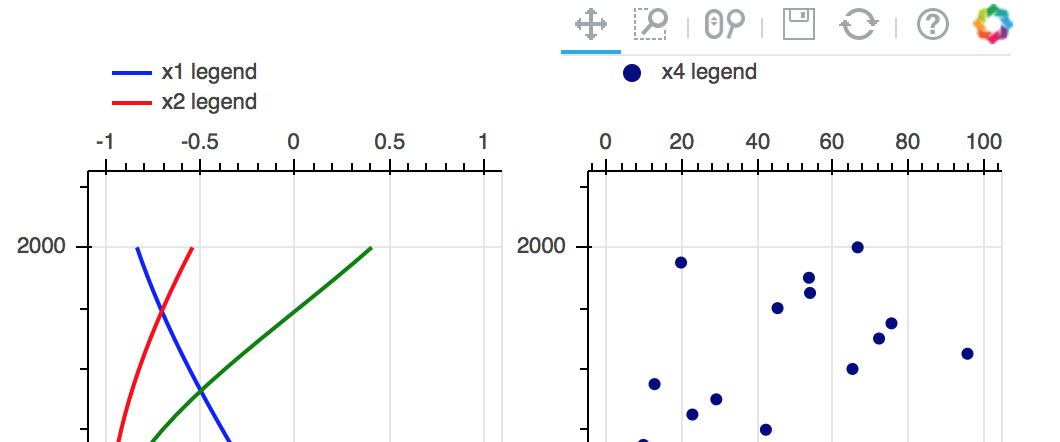
The first picture attached shows if I only have one legend entry (with 2 items) on p1 with add_layout, and one legend entry with add_layout to p2. That works fine.
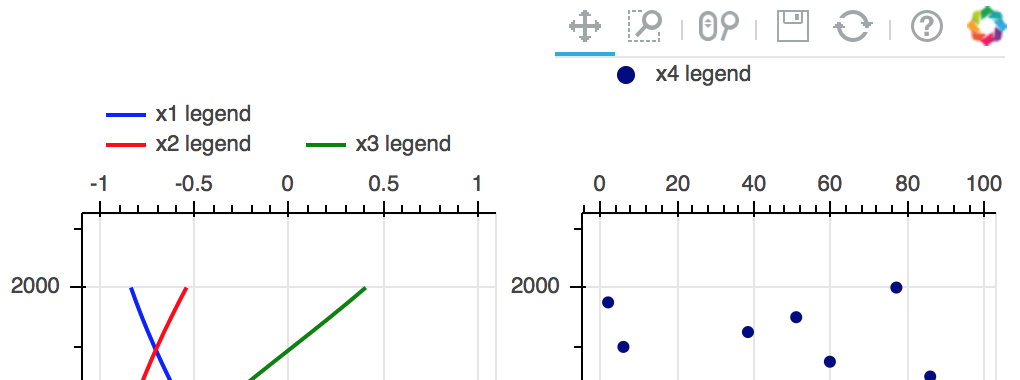
Picture 2 shows how it looks with 3 legends on p1. Here I use 2 add_layouts for the legends to p1. However the legend for p2 is now at an other distance from the axis (I have not adjusted the location).
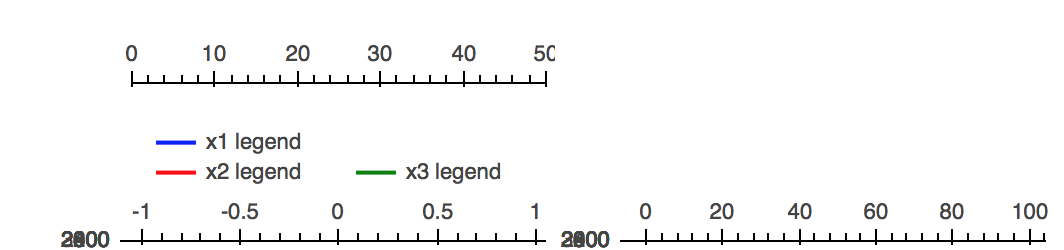
Picture 3 is when I add an extra_x_range and legend item for that range. The plots end up collapsing.
Not sure if I have misunderstood the add_layout functionality, but I do not understand why the add_layout in p2 is affected by the p1 add_layouts. Also why do the plots collapse? I have searched and found a comment regarding adding title = None which I have done.
Any help appreciated.
Attached pictures:
-
Pic 1: add_layout-2-legends: 2 legend items added to p1, 1 legend item to p2
-
Pic 2: add_layout-3-legends: 3 legend items added to p1, 1 legend item to p2
-
Pic 3: add_layout-3-legends_extra_x_range: extra x_range added p1 and legend item
···
import numpy as np
from bokeh.io import output_file, show
from bokeh.layouts import gridplot
from bokeh.plotting import figure
from bokeh.models import DataRange1d, Legend, LinearAxis, Range1d
y = np.linspace(2000, 3000, 101)
x1 = np.cos(y/200)
x2 = np.sin(y/200)
x3 = np.cos(y/100)
x4 = np.random.rand(101) * 100
x5 = x4 / 2
output_file(“add_layout_legends.html”)
p1 = figure(width = 250, height = 900,
x_axis_location = “above”,
x_range = (-1.05,1.05),
y_range = DataRange1d(flipped = True),
title = None)
x1_line = p1.line(x = x1, y = y, color = “blue”, line_width = 2)
x2_line = p1.line(x = x2, y = y, color = “red”, line_width = 2)
x3_line = p1.line(x = x3, y = y, color = “green”, line_width = 2)
p1.extra_x_ranges = {“x5_rng”: Range1d(start = 0, end = 50)}
x5_circ = p1.circle(x = x5, y = y, color = “navy”, size = 5, x_range_name = “x5_rng”)
p1_legend = Legend(items=[(“x1 legend”, [x1_line]),
(“x2 legend”, [x2_line])],
border_line_color = None,
location = (50,0),
padding = 0,
spacing = -5,
label_text_font_size = “8pt”)
p1.add_layout(p1_legend, “above”)
p1x3_legend = Legend(items=[(“x3 legend”, [x3_line])],
border_line_color = None,
location = (150,-35),
padding = 0,
spacing = -5,
label_text_font_size = “8pt”)
p1.add_layout(p1x3_legend, “above”)
p1.add_layout(LinearAxis(x_range_name=“x5_rng”), “above”)
p1x5_legend = Legend(items=[(“x5 legend”, [x5_circ])],
border_line_color = None,
location = (100,0),
padding = 0,
spacing = -5,
label_text_font_size = “8pt”)
p1.add_layout(p1x5_legend, “above”)
p2 = figure(width = 250, height = 900,
x_axis_location = “above”,
y_range = p1.y_range,
title = None)
x4_circ = p2.circle(x = x4, y = y, color = “navy”, size = 5)
p2_legend = Legend(items=[(“x4 legend”, [x4_circ])],
border_line_color = None,
location = (50,0),
padding = 0,
label_text_font_size = “8pt”)
p2.add_layout(p2_legend, “above”)
grid = gridplot([p1, p2], ncols = 2)
show(grid)