Add legend item without instances / Add legend item afterwards

Hi guys,

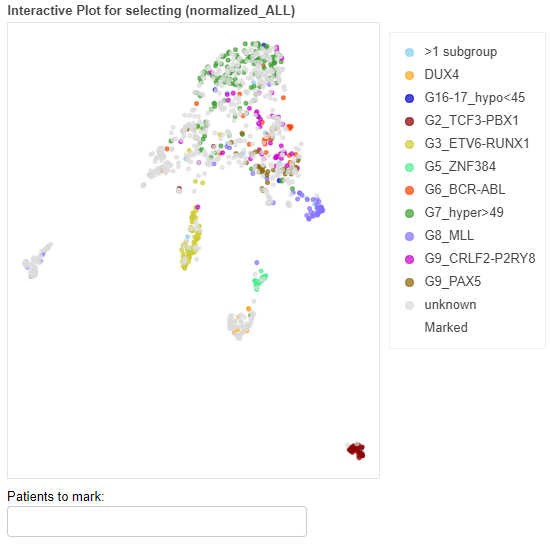
for a university project I use bokeh to visualize patient samples and color them to their corresponding class. the data frame “data” consists of a x, y, color, id (called here “patient”) and class (called here “subgroup”) column:

dimGrey = "#696969"  # Used for "Marked" subgroup

[...]

s1 = ColumnDataSource(data)
p1 = figure(tools="lasso_select, wheel_zoom, box_zoom, reset", tooltips=tooltips, title="Interactive Plot for selecting ({}) ".format(names[i]))
p1.circle('x', 'y', source=s1, alpha=0.7, color=plotColors, legend_group='label')

# Initial approach
p1.circle([], [], color='dimGrey', legend_label="Marked")

[...]

p1.add_layout(p1.legend[0], 'right')
# You can ignore t2 and savebutton for that problem
grid = gridplot([[p1, t2], [text_input, savebutton]], sizing_mode='stretch_both')
show(grid)

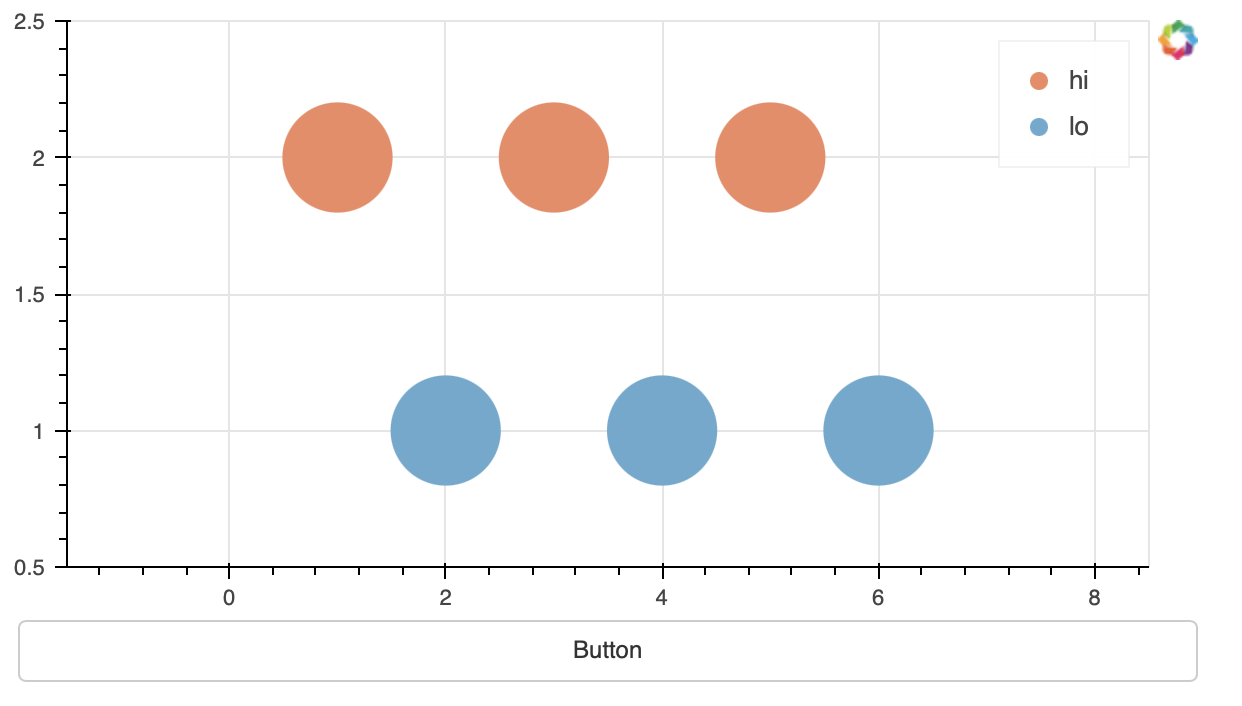
The result is as expected:

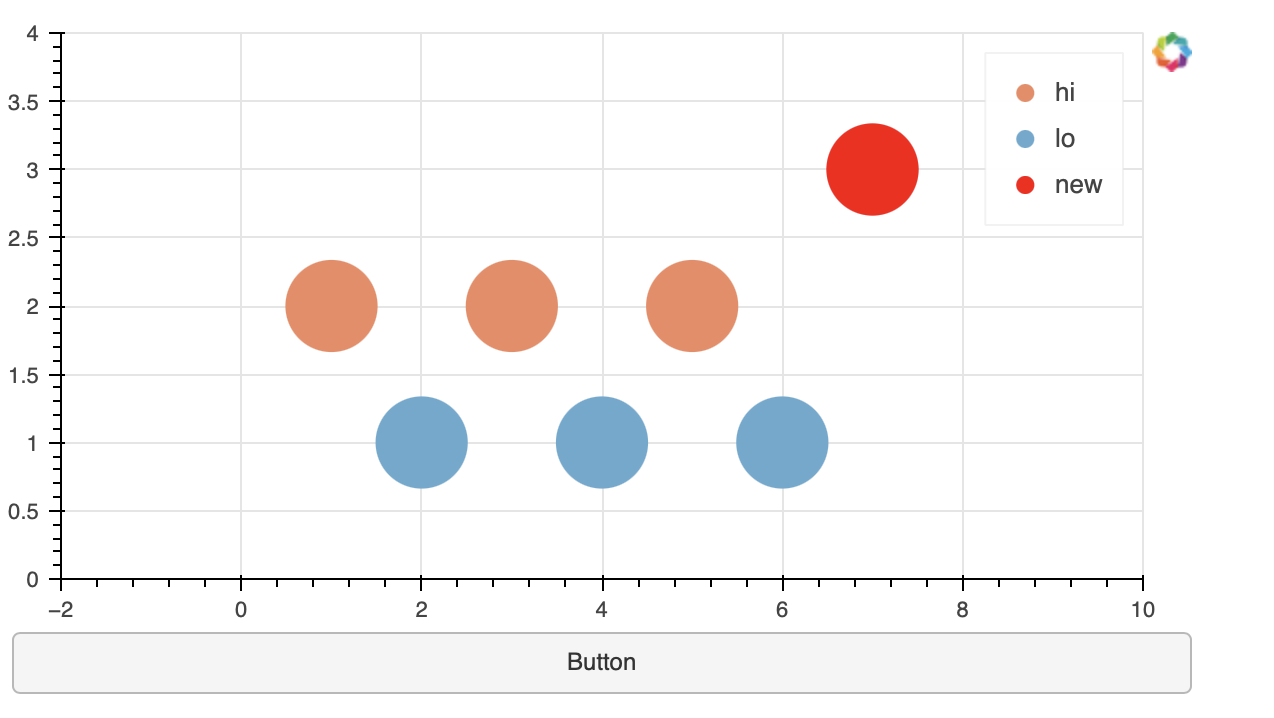
I included a text input widget which takes a list of id’s and colors all given samples to grey (ignore s2 and t2 those are for a different purpose):

text_input = TextInput(value="", title="Patients to mark:", sizing_mode='fixed')
text_input.js_on_change("value", CustomJS(args=dict(s1=s1,s2=s2,t2=t2), code="""
    var d1 = s1.data;
    var d2 = s2.data;
    var numPatients = d1['patient'].length;
    
    var val = this.value.toString().trim();
    var tokens = val.split(/\s*,\s*/);
    
    for (var w = 0; w < tokens.length; w++){
  
        for (var i = 0; i < numPatients; i++) {
            if (tokens[w] == d1['patient'][i]){
                d1['color'][i] = '#696969'; #thats the grey color mentioned
                d1['subgroup'][i] = 'Marked';
                
                for (var j = 0; j < d2['patient'].length; j++){ #ignore this, d2 is used for a seperate table
                    if(tokens[w] == d2['patient'][j]){
                        d2['subgroup'][j] = 'Marked';
                    }
                }
                
            }
        }
    }
    
    s1.change.emit();
    t2.change.emit();
    """))

My ultimate goal is to add an legend item with the label “Marked” as soon as atleast one samples is colored grey via the text input and to delete the legend item as soon as the marked sample is reseted to it’s original color (I already implemented the reset feature).
I initially tried to implemented a simplified version by adding the extra legend item permanently (which would be fine for now) but it looks like that legend items need a corresponding sample to visualize the colored circle (there is non in the above image for “Marked”), which aren’t their for the marked subgroup at the beginning. So I did the following: Added a pseudo sample with the subgroup/class “Marked” and color “dimGrey” and just put it far away from the other samples and adjusted the ranges of the plot, so the pseudo sample is not seen. With legend_group=‘label’ a correct legenditem is created but I don’t like this solution. With the tool hover wheel you can simply zoom out and see the pseudo sample if you zoom out enough. The code above is my inital approach, not the version with the pseudo sample.

Any ideas how to solve this elegantly?

Thanks in advance.

Peddy

@p-fardzadeh I don’t think you are going to have easy success using legend_group for the legend. legend_group does a one-shot, up-front grouping on the Python side, before the plot ever gets to the browser. Once it is in the browser, it is stuck in place, and adding new things will require lots of tedious and error-prone manual grouping in JS code.

Fortunately, there is another option, which which is to use legend_field instead. legend_field does the grouping on the JavaScript side, in the browser, and also responds when the data source updates. Here is a short complete example that shows how new data can update the legend:

from bokeh.io import show
from bokeh.models import Button, ColumnDataSource, CustomJS
from bokeh.palettes import RdBu3
from bokeh.plotting import column, figure

c1 = RdBu3[2] # red
c2 = RdBu3[0] # blue
source = ColumnDataSource(dict(
    x=[1, 2, 3, 4, 5, 6],
    y=[2, 1, 2, 1, 2, 1],
    color=[c1, c2, c1, c2, c1, c2],
    label=['hi', 'lo', 'hi', 'lo', 'hi', 'lo']
))

p = figure(height=300, tools='')
p.x_range.range_padding = 1
p.y_range.range_padding = 1

p.circle( x='x', y='y', radius=0.5, color='color', legend_field='label', source=source)

b = Button()
b.js_on_click(CustomJS(args=dict(source=source), code="""
    source.data.x.push(7)
    source.data.y.push(3)
    source.data.color.push("#ff0000")
    source.data.label.push("new")
    console.log(source.data)
    source.change.emit()
"""))

show(column(p, b))

This is the initial render:

and after pushing the button:

2 Likes

Thit is all I needed. Thank you a lot!

Next time I should read the documents more in depth…

Have a nice day!

Edit: One little detail which is missing, is that the new label should be at the end or beginning (both is fine). Is this even possible to reorder the legend items via legend_field?

I tried to access the legend items in my callback, but I just get errors in JS, telling me that I can’t access legend[0].items (or legend.items):

text_input.js_on_change("value", CustomJS(args=dict(s1=s1,s1Copy=s1Copy,s2=s2,t2=t2, p1=p1), code="""

[...]

var p = p1
var legendItems= p1.legend[0].items; #tried "p1.legend.items" as well
    
for (var i = 0; i < legendItems.length; i++) {
    if (legendItems[i].label == "Marked") {
        legendItems.push(legendItems.splice(i, 1)[0]);
    }
}

[...]

Thanks.

1 Like

legend_field is specialized to be able to do the dynamic grouping. It handles the items internally and they are not exposed in any useful way (e.g. to reorder them). You could make a GitHub Issue to request some mechanism for controlling the order in future development. Currently you would have to go back manually managing all legend items for that level of control.

1 Like

This topic was automatically closed 90 days after the last reply. New replies are no longer allowed.