I’m developing an application with bokeh server,
plots are added dynamically and uses a button widget that adds and Span, Span is added properly but toolbar disappears
Hi,
It is impossible to investigate or to help without some code to go on, ideally a minimal complete example that can be run to reproduce what you are seeing.
Thanks,
Bryan
···
On Jan 26, 2018, at 14:46, [email protected] wrote:
I'm developing an application with bokeh server,
plots are added dynamically and uses a button widget that adds and Span, Span is added properly but toolbar disappears--
You received this message because you are subscribed to the Google Groups "Bokeh Discussion - Public" group.
To unsubscribe from this group and stop receiving emails from it, send an email to [email protected].
To post to this group, send email to [email protected].
To view this discussion on the web visit https://groups.google.com/a/continuum.io/d/msgid/bokeh/871346d0-52d8-4c40-9549-d982bcdd3c7b%40continuum.io\.
For more options, visit https://groups.google.com/a/continuum.io/d/optout\.
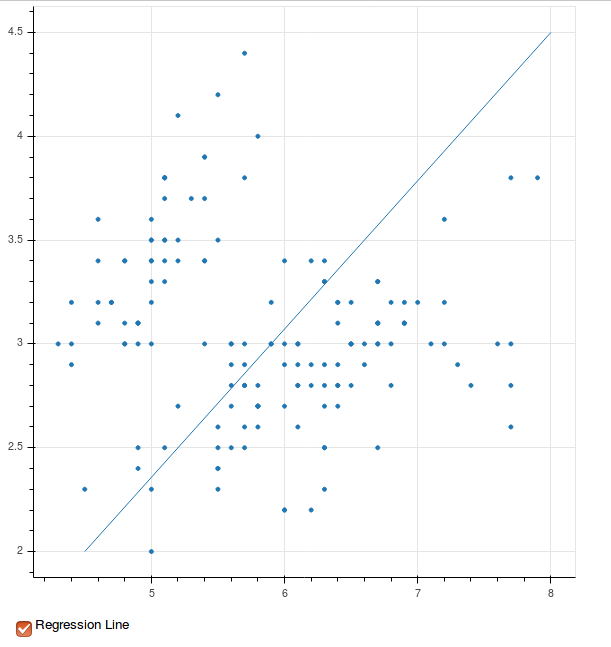
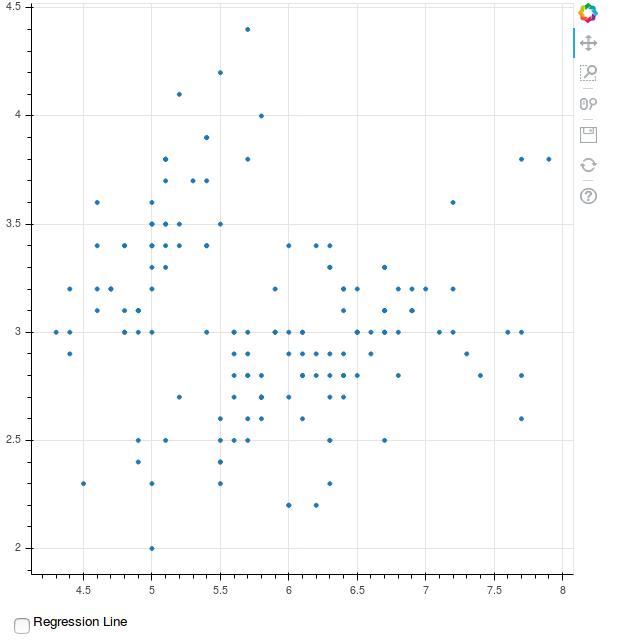
I’m having a similar problem using bokeh server. In some circumstances when I add another model to a figure (in this case a line) dynamically the toolbar disappears. It seems to only happen after I clear the curdoc and add a new root or replace the existing layout. I coded up a quick example to replicate the behavior. Note: this code does not have a lot of features that my full app does, so some things that seem useless such as the first page with the continue button will seem useless here but may have some use in the full app.
from bokeh.plotting import figure, curdoc
from bokeh.models import ColumnDataSource, CheckboxGroup, Button
from bokeh.models.renderers import GlyphRenderer
from bokeh.layouts import layout
import pandas as pd
from sklearn import datasets
df = pd.DataFrame(datasets.load_iris().data, columns=[“Sepal_Length”, “Sepal_Width”, “Petal_Length”, “Petal_Width”])
df[“Species”] = datasets.load_iris().target
doc = curdoc()
class TestRepl:
def __init__(self):

    self.p = None

def add_glyph(self, attr, old, new):

    if new:

        self.p.line([4.5, 8], [2, 4.5], name="testline")

    else:

        renderer = [r for r in self.p.renderers if isinstance(r, GlyphRenderer)]

        for r in renderer:

            if r.name == "testline":

                self.p.renderers.remove(r)

def first_callback(self):

    doc.clear()

    app_layout = self.first_graph()

    doc.add_root(app_layout)

def first_graph(self):

    self.p = figure()

    source = ColumnDataSource(data=dict(x=df["Sepal_Length"].tolist(), y=df["Sepal_Width"].tolist()))

    self.p.scatter('x', 'y', source=source)

    reg_check = CheckboxGroup(labels=["Regression Line"])

    reg_check.on_change("active", self.add_glyph)

    app_layout = layout([[self.p],
                         [reg_check]])

    return app_layout
tr = TestRepl()
b = Button(label=“continue”)
b.on_click(tr.first_callback)
app_layout = layout(b)
doc.add_root(app_layout)
``
Some steps I took to find a fix:
When the additional line is added before the doc.add_root call in the first_callback function the code works as expected. However, that means the user won’t be able to toggle the line on and off as intended.
Commenting out the self.p.line in add_glyph stops the toolbar from disappearing but also doesn’t add the line to the figure.
When
the graph is made immediately, without the first page with the continue
button the code works as expected. However, in my full use case that page is used to set a number of options for the graph.
Changed some code to replace the layout.children instead of clearing the curdoc.
replace TestRepl init
def init(self):
self.p = None
self.app_layout = None
replace TestRepl first_callback
def first_callback(self):
layout = self.first_graph()

self.app_layout.children = layout.children
replace final 2 lines of code
tr.app_layout = layout(b)
doc.add_root(tr.app_layout)
``
Toolbar still disappeared.
···
On Friday, January 26, 2018 at 3:50:22 PM UTC-5, Bryan Van de ven wrote:
Hi,
It is impossible to investigate or to help without some code to go on, ideally a minimal complete example that can be run to reproduce what you are seeing.
Thanks,
Bryan
On Jan 26, 2018, at 14:46, [email protected] wrote:
I’m developing an application with bokeh server,
plots are added dynamically and uses a button widget that adds and Span, Span is added properly but toolbar disappears–
You received this message because you are subscribed to the Google Groups “Bokeh Discussion - Public” group.To unsubscribe from this group and stop receiving emails from it, send an email to [email protected].
To post to this group, send email to [email protected].
To view this discussion on the web visit https://groups.google.com/a/continuum.io/d/msgid/bokeh/871346d0-52d8-4c40-9549-d982bcdd3c7b%40continuum.io.
For more options, visit https://groups.google.com/a/continuum.io/d/optout.
This is a known bug:
Disappearing Toolbar · Issue #7497 · bokeh/bokeh · GitHub
Bryan
···
On Mar 23, 2018, at 06:34, [email protected] wrote:
I'm having a similar problem using bokeh server. In some circumstances when I add another model to a figure (in this case a line) dynamically the toolbar disappears. It seems to only happen after I clear the curdoc and add a new root or replace the existing layout. I coded up a quick example to replicate the behavior. Note: this code does not have a lot of features that my full app does, so some things that seem useless such as the first page with the continue button will seem useless here but may have some use in the full app.
from bokeh.plotting import figure, curdoc
from bokeh.models import ColumnDataSource, CheckboxGroup, Button
from bokeh.models.renderers import GlyphRenderer
from bokeh.layouts import layout
import pandas as pd
from sklearn import datasetsdf = pd.DataFrame(datasets.load_iris().data, columns=["Sepal_Length", "Sepal_Width", "Petal_Length", "Petal_Width"])
df["Species"] = datasets.load_iris().target
doc = curdoc()class TestRepl:
def __init__(self):
self.p = None
def add_glyph(self, attr, old, new):
if new:
self.p.line([4.5, 8], [2, 4.5], name="testline")
else:
renderer = [r for r in self.p.renderers if isinstance(r, GlyphRenderer)]
for r in renderer:
if r.name == "testline":
self.p.renderers.remove(r)
def first_callback(self):
doc.clear()
app_layout = self.first_graph()
doc.add_root(app_layout)
def first_graph(self):
self.p = figure()
source = ColumnDataSource(data=dict(x=df["Sepal_Length"].tolist(), y=df["Sepal_Width"].tolist()))
self.p.scatter('x', 'y', source=source)
reg_check = CheckboxGroup(labels=["Regression Line"])
reg_check.on_change("active", self.add_glyph)
app_layout = layout([[self.p],
[reg_check]])return app_layout
tr = TestRepl()
b = Button(label="continue")
b.on_click(tr.first_callback)
app_layout = layout(b)
doc.add_root(app_layout)
Some steps I took to find a fix:
When the additional line is added before the doc.add_root call in the first_callback function the code works as expected. However, that means the user won't be able to toggle the line on and off as intended.
Commenting out the self.p.line in add_glyph stops the toolbar from disappearing but also doesn't add the line to the figure.
When the graph is made immediately, without the first page with the continue button the code works as expected. However, in my full use case that page is used to set a number of options for the graph.
Changed some code to replace the layout.children instead of clearing the curdoc.# replace TestRepl __init__
def __init__(self):self.p = None
self.app_layout = None# replace TestRepl first_callback
def first_callback(self):layout = self.first_graph()
self.app_layout.children = layout.children
# replace final 2 lines of code
tr.app_layout = layout(b)doc.add_root(tr.app_layout)
Toolbar still disappeared.
On Friday, January 26, 2018 at 3:50:22 PM UTC-5, Bryan Van de ven wrote:
Hi,It is impossible to investigate or to help without some code to go on, ideally a minimal complete example that can be run to reproduce what you are seeing.
Thanks,
Bryan
> On Jan 26, 2018, at 14:46, garcia.per...@gmail.com wrote:
>
> I'm developing an application with bokeh server,
> plots are added dynamically and uses a button widget that adds and Span, Span is added properly but toolbar disappears
>
> --
> You received this message because you are subscribed to the Google Groups "Bokeh Discussion - Public" group.
> To unsubscribe from this group and stop receiving emails from it, send an email to bokeh+un...@continuum.io.
> To post to this group, send email to bo...@continuum.io.
> To view this discussion on the web visit https://groups.google.com/a/continuum.io/d/msgid/bokeh/871346d0-52d8-4c40-9549-d982bcdd3c7b%40continuum.io\.
> For more options, visit https://groups.google.com/a/continuum.io/d/optout\.--
You received this message because you are subscribed to the Google Groups "Bokeh Discussion - Public" group.
To unsubscribe from this group and stop receiving emails from it, send an email to [email protected].
To post to this group, send email to [email protected].
To view this discussion on the web visit https://groups.google.com/a/continuum.io/d/msgid/bokeh/ad20b0dc-b2e3-4fc3-a780-1e08a3f1a0f6%40continuum.io\.
For more options, visit https://groups.google.com/a/continuum.io/d/optout\.
<After Adding Line.png><Before Adding Additional Line.png>