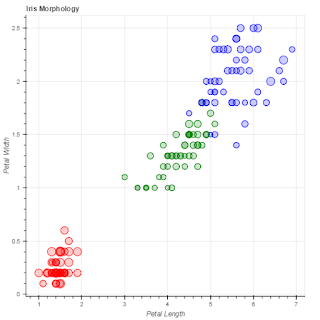
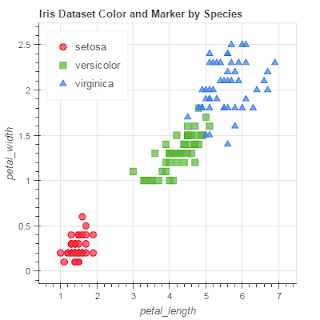
Hi I was looking at the two implementations of the Iris graph example:
The one that uses bokeh.plotting: iris.py — Bokeh 2.4.2 Documentation
and the one that uses bokeh.charts: http://bokeh.pydata.org/en/latest/docs/gallery/iris_scatter_chart.html
Now, I was trying to add a legend to the first graph and I just wanted to ask here whether I am doing it correctly. Here is the code I used:
from bokeh.plotting import figure, show, output_notebook, output_file
from bokeh.sampledata.iris import flowers
colormap = {‘setosa’: ‘red’, ‘versicolor’: ‘green’, ‘virginica’: ‘blue’}
flowers[‘colors’] = [colormap for x in flowers[‘species’]]
p = figure(title = “Iris Morphology”)
p.xaxis.axis_label = ‘Petal Length’
p.yaxis.axis_label = ‘Petal Width’
p.circle(flowers[“petal_length”][flowers[‘colors’]==‘red’], flowers[“petal_width”][flowers[‘colors’]==‘red’],
color=flowers['colors'][flowers['colors']=='red'], fill_alpha=0.2, size=flowers['sepal_width']*4,legend='Setosa')
p.circle(flowers[“petal_length”][flowers[‘colors’]==‘green’], flowers[“petal_width”][flowers[‘colors’]==‘green’],
color=flowers['colors'][flowers['colors']=='green'], fill_alpha=0.2, size=flowers['sepal_width']*4,legend='Versicolor')
p.circle(flowers[“petal_length”][flowers[‘colors’]==‘blue’], flowers[“petal_width”][flowers[‘colors’]==‘blue’],
color=flowers['colors'][flowers['colors']=='blue'], fill_alpha=0.2, size=flowers['sepal_width']*4,legend='Virginica')
output_notebook()
show(p)
``
That will add one item in the legend for each of the three types of flowers. So, I just wanted to ask whether this is the correct way to add multi-item legends using the plotting interface, or am I missing some a more bokehish method there?

