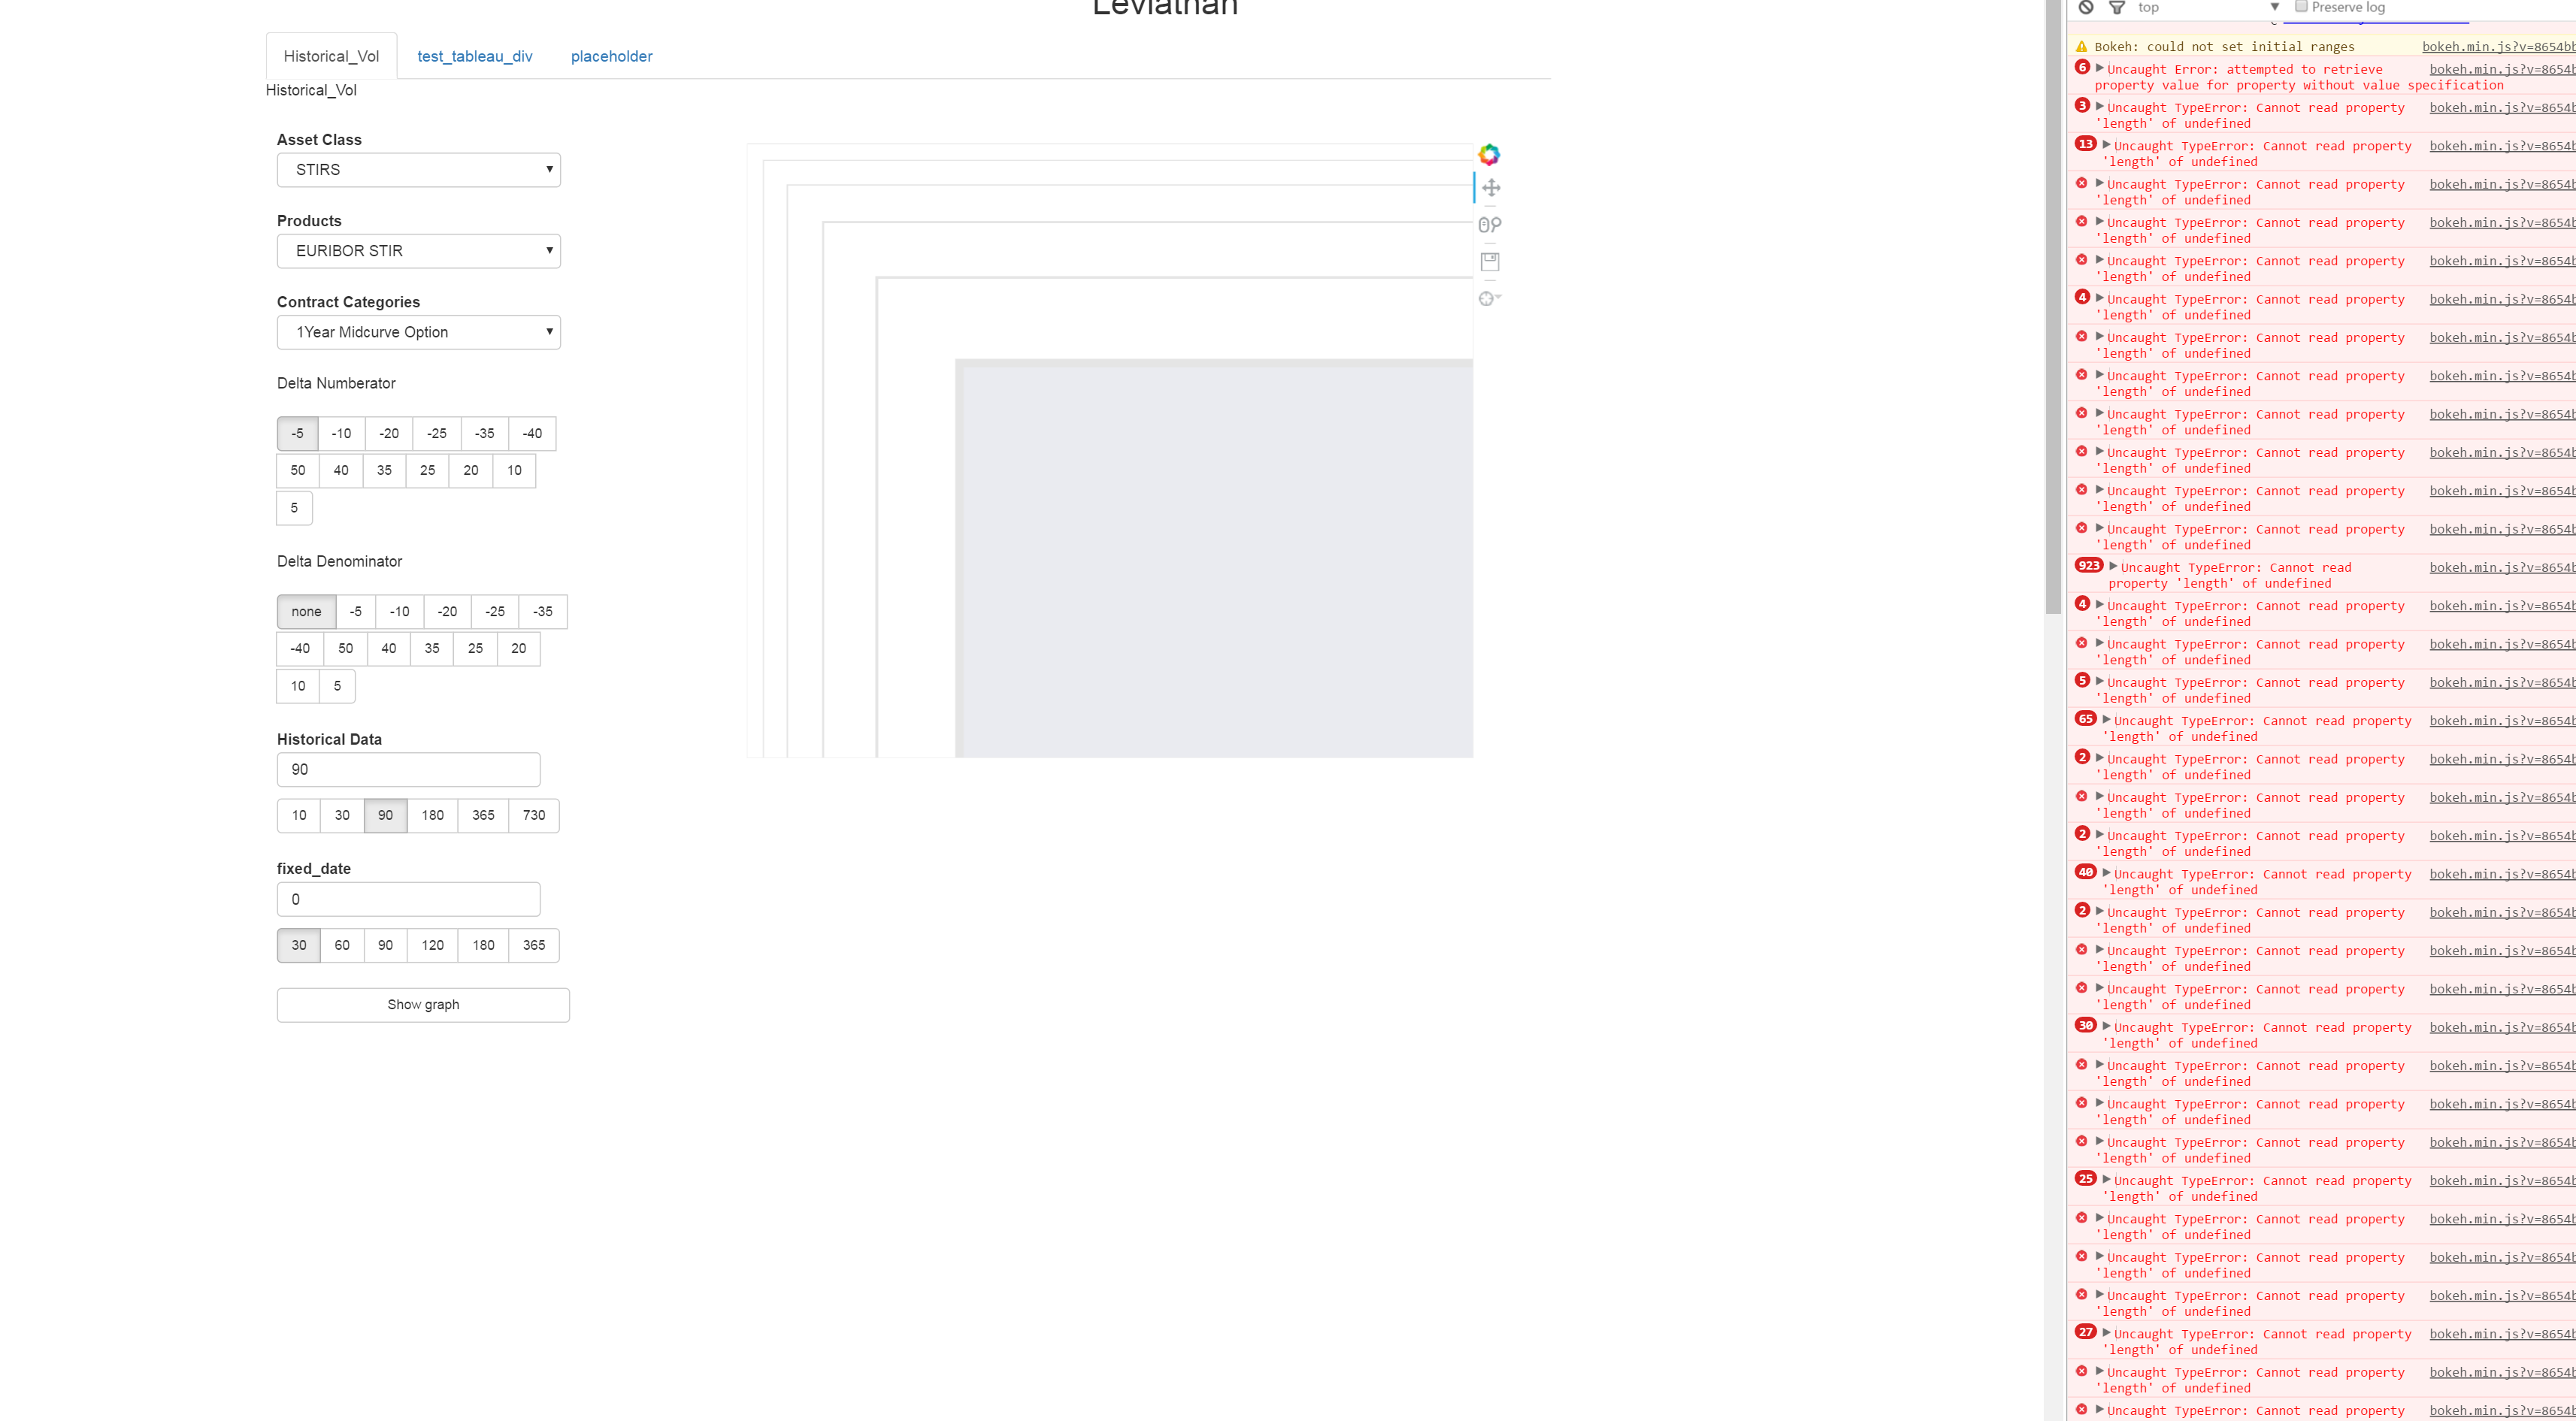
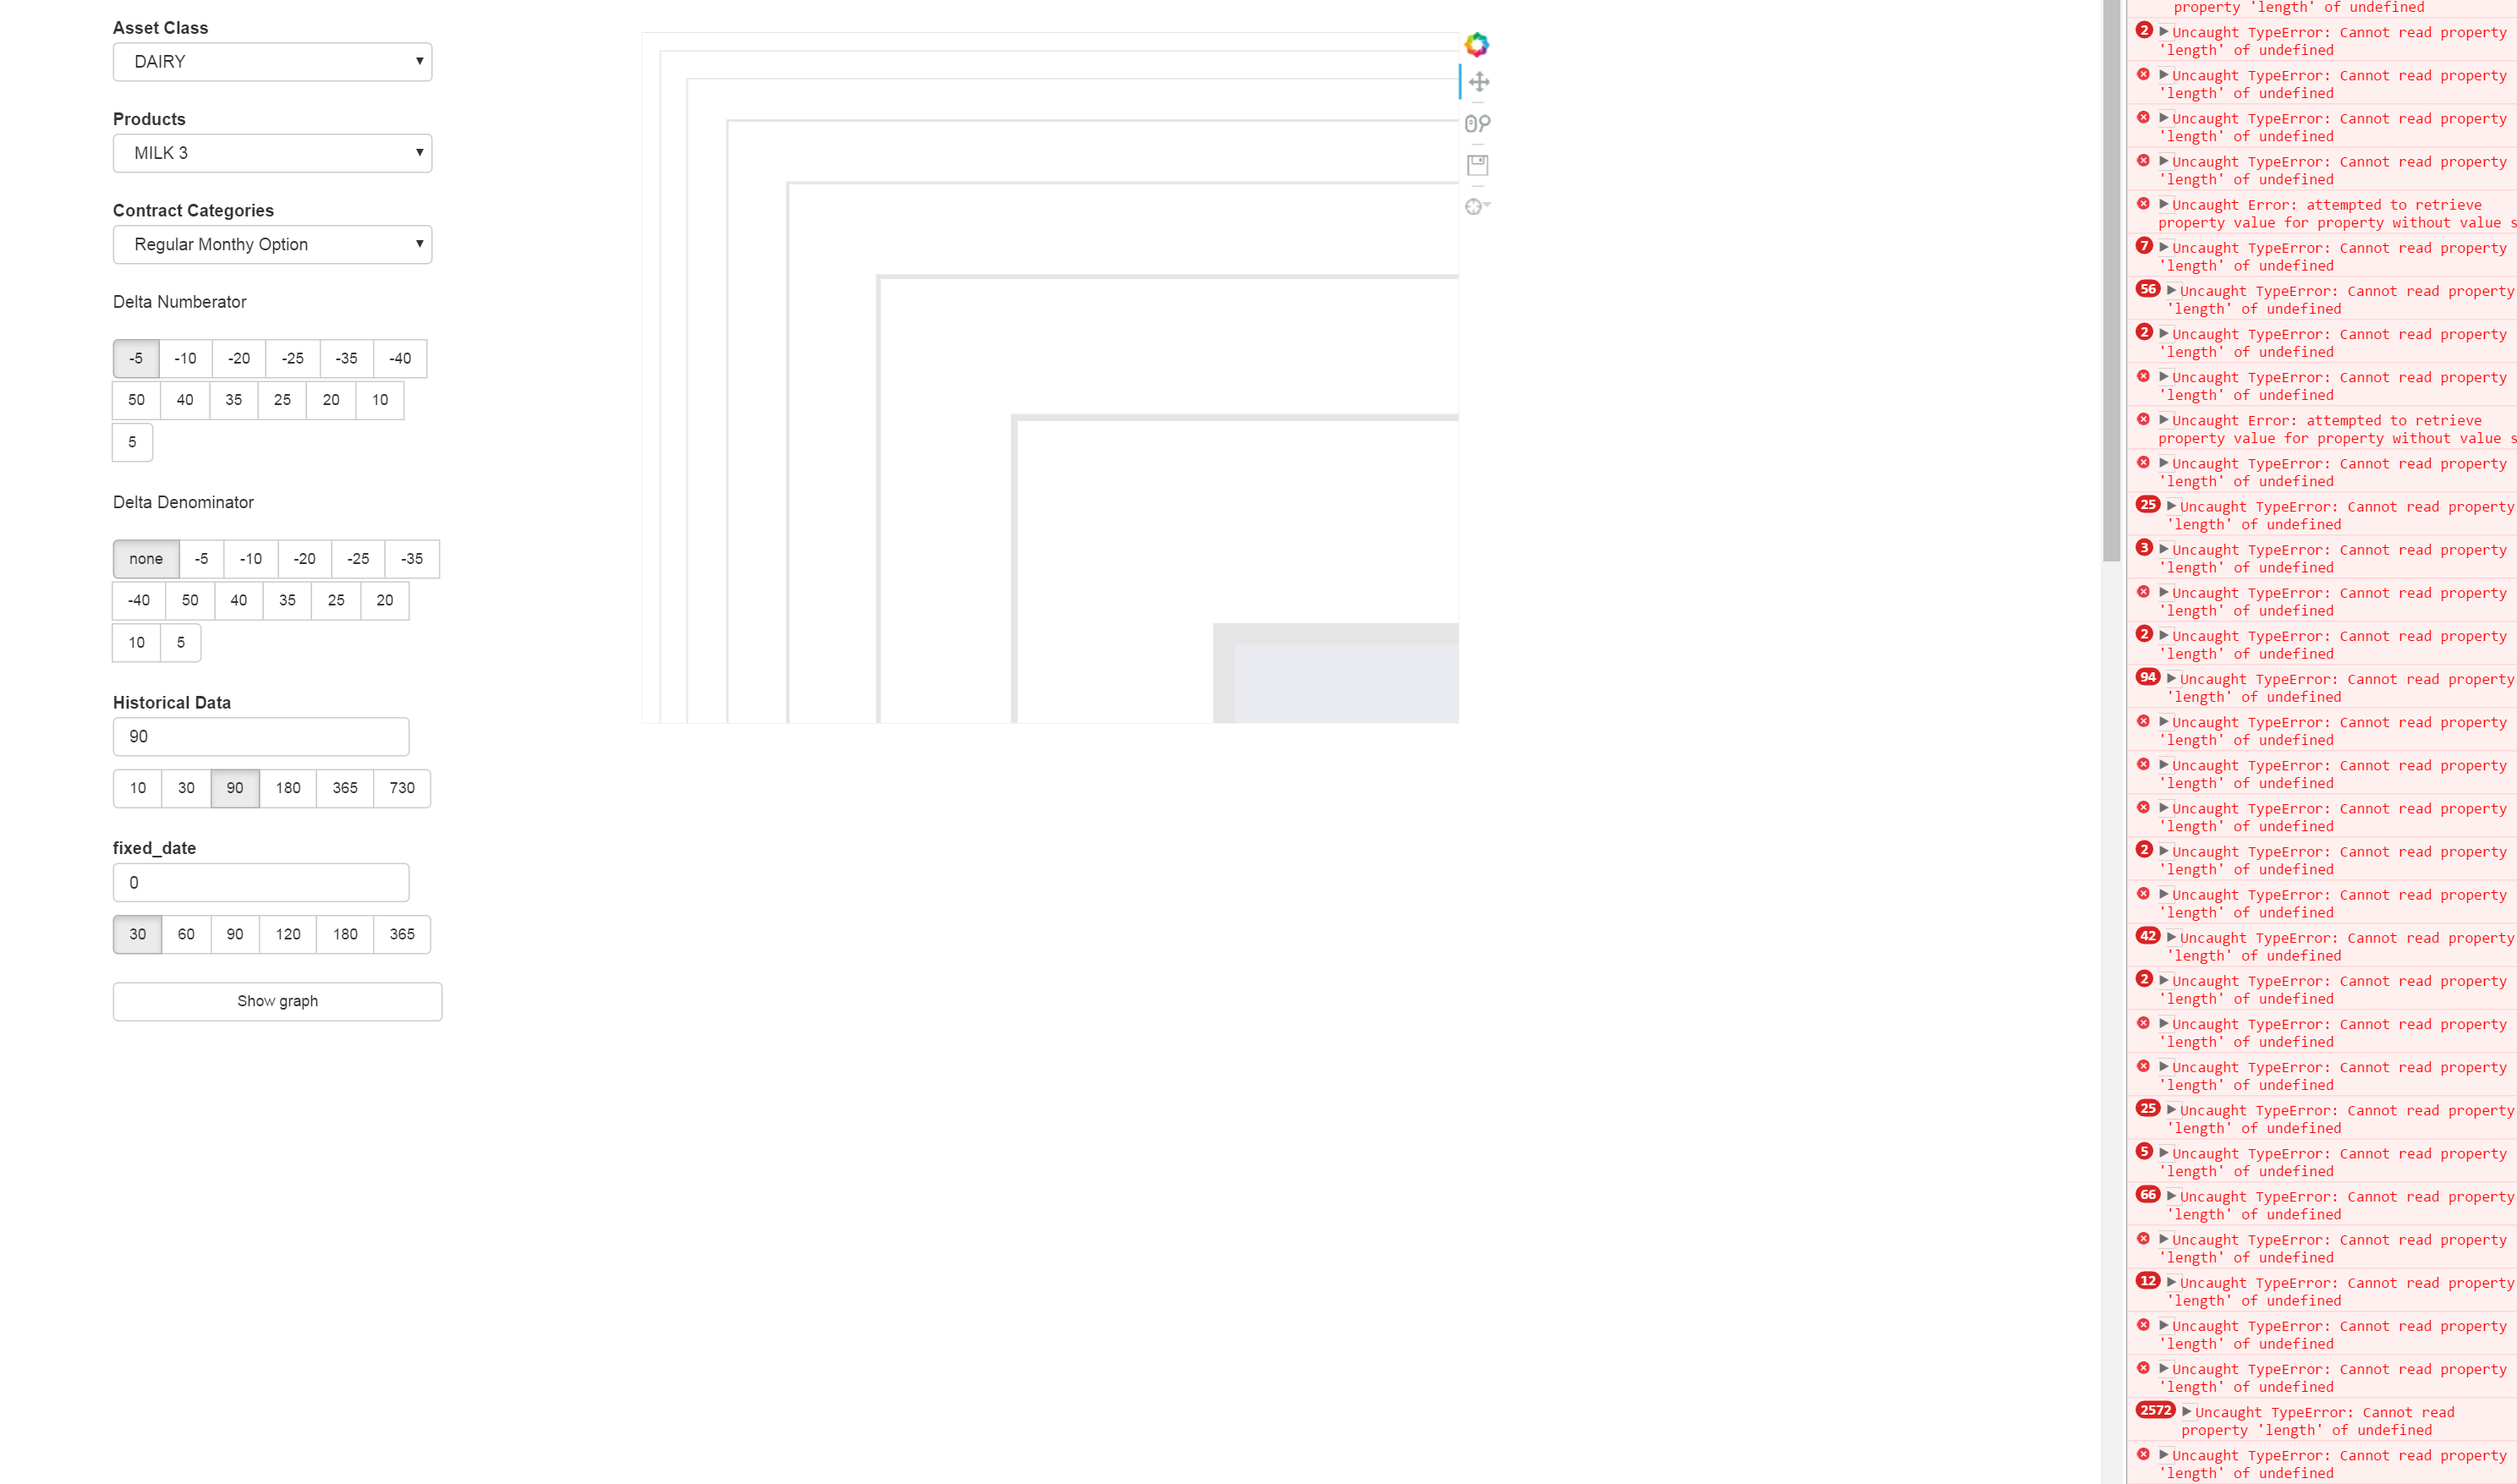
adding background fill causes wonky behavior

I have a plot and some widgets in a document, and everything works fine, but when I set the background_fill_color of my plot, it starts to act strangely (see attached pictures). Every time I change a select box, I get the error “Uncaught Error: attempted to retrieve property value for property without value specification”, the colored section of the plot moves down and to the right within the plot, hiding more and more of the plot each time I move it. Also, every time I enter, exit, or move around in the plot with my mouse, I get the error in the javascript: “Uncaught TypeError: Cannot read property ‘length’ of undefined”. I’m curious if you’ve seen this before, and have any suggestions as to solutions

I saw something
similar, but in a very different context recently (although I’ve for gotten
where) . Are you able to share, at the
least, the code that makes the plot and the code that
updates the plot?

···

On 7/20/16 11:19 AM,
wrote:

[email protected]

    I have a plot and some widgets in a document, and

everything works fine, but when I set the background_fill_color
of my plot, it starts to act strangely (see attached pictures).
Every time I change a select box, I get the error “Uncaught
Error: attempted to retrieve property value for property without
value specification”, the colored section of the plot moves down
and to the right within the plot, hiding more and more of the
plot each time I move it. Also, every time I enter, exit, or
move around in the plot with my mouse, I get the error in the
javascript: “Uncaught TypeError: Cannot read property ‘length’
of undefined”. I’m curious if you’ve seen this before, and have
any suggestions as to solutions

  You received this message because you are subscribed to the Google

Groups “Bokeh Discussion - Public” group.

  To unsubscribe from this group and stop receiving emails from it,

send an email to [email protected].

  To post to this group, send email to [email protected].

  To view this discussion on the web visit [https://groups.google.com/a/continuum.io/d/msgid/bokeh/d99bd920-cbe9-41c5-accf-e377df6749a2%40continuum.io](https://groups.google.com/a/continuum.io/d/msgid/bokeh/d99bd920-cbe9-41c5-accf-e377df6749a2%40continuum.io?utm_medium=email&utm_source=footer).

  For more options, visit [https://groups.google.com/a/continuum.io/d/optout](https://groups.google.com/a/continuum.io/d/optout).


Sarah Bird
Developer, Bokeh

    [
      ![Continuum Analytics](http://docs.continuum.io/_static/img/ContinuumWordmark.png)
    ](http://continuum.io)

#making the plot

def buildPlot():

plot = Figure(x_axis_type="datetime", plot_width=700,tools=[HoverTool(tooltips=[("vol","$y"),("Date","@formDates")]),PanTool(),WheelZoomTool(),SaveTool()])

plot.background_fill_color='#EAEBF0'

plot.background_fill_alpha=1

plot.xgrid.grid_line_color = 'white'

plot.ygrid.grid_line_color = ‘white’

plot.title.text = "a"

plot.xaxis.axis_label="a"

plot.yaxis.axis_label="a"

line = plot.line([],[],line_width=4,color="black")

parts = {'line':line,'plot':plot}

return parts

#on_change method call that seems to break the plot

def selectChange(attrname,old,new):

another_select.options=pd_dataframe[pd_dataframe['an_index']==select.value]['Product'].unique().tolist()

another_select.value = prod.options[0]

select.on_change(‘value’,asClsChange)

the select box change has no interaction with the graph whatsoever, and this only happens when I change the background color of the plot. Also as a disclaimer, I have altered bokeh’s source code slightly (as described here https://groups.google.com/a/continuum.io/forum/#!topic/bokeh/mhEDh7a3AcQ), but that’s in something that wouldn’t effect the plot, I don’t think.

https://groups.google.com/a/continuum.io/forum/#!topic/bokeh/mhEDh7a3AcQ

),

Also, moving the definition of background_fill_color to after the definition of the plot title text makes the issue disappear

Adam,

at least in the code you provided, you are not using the selectChange callback in .on_change:

    def selectChange(attrname,old,new):
  another_select.options=pd_dataframe[pd_dataframe['an_index']==select.value]['Product'].unique().tolist()
  another_select.value = prod.options[0]
    
    select.on_change('value',asClsChange) # asClsChange -> selectChange ?

Thanks,

Bryan

···

On Jul 20, 2016, at 5:01 PM, [email protected] wrote:

#making the plot
def buildPlot():
  plot = Figure(x_axis_type="datetime", plot_width=700,tools=[HoverTool(tooltips=[("vol","$y"),("Date","@formDates")]),PanTool(),WheelZoomTool(),SaveTool()])
  plot.background_fill_color='#EAEBF0'
  plot.background_fill_alpha=1
  plot.xgrid.grid_line_color = 'white'
        plot.ygrid.grid_line_color = 'white'
  plot.title.text = "a"
  plot.xaxis.axis_label="a"
  plot.yaxis.axis_label="a"
  line = plot.line(,,line_width=4,color="black")
  parts = {'line':line,'plot':plot}
  return parts
#on_change method call that seems to break the plot
def selectChange(attrname,old,new):
  another_select.options=pd_dataframe[pd_dataframe['an_index']==select.value]['Product'].unique().tolist()
  another_select.value = prod.options[0]
select.on_change('value',asClsChange)

the select box change has no interaction with the graph whatsoever, and this only happens when I change the background color of the plot. Also as a disclaimer, I have altered bokeh's source code slightly (as described here Redirecting to Google Groups), but that's in something that wouldn't effect the plot, I don't think.

Redirecting to Google Groups

),

--
You received this message because you are subscribed to the Google Groups "Bokeh Discussion - Public" group.
To unsubscribe from this group and stop receiving emails from it, send an email to [email protected].
To post to this group, send email to [email protected].
To view this discussion on the web visit https://groups.google.com/a/continuum.io/d/msgid/bokeh/9cd3e0f3-1587-4f90-b6b4-6a063e98bccb%40continuum.io\.
For more options, visit https://groups.google.com/a/continuum.io/d/optout\.

I generalized the variable/method names for the sake of my post, I forgot to change that one. That’s not the issue in the code

OK well then my next comment is that you state that the select has no interaction with the plot, but the select callback you showed is only modifying another select box, so that so that does not seem surprising to me. Can you pare things down to a minimal runnable test case that you can provide? It's basically difficult/impossible to do anything besides speculate without running actual code.

Thanks,

Bryan

···

On Jul 21, 2016, at 2:37 PM, [email protected] wrote:

I generalized the variable/method names for the sake of my post, I forgot to change that one. That's not the issue in the code

--
You received this message because you are subscribed to the Google Groups "Bokeh Discussion - Public" group.
To unsubscribe from this group and stop receiving emails from it, send an email to [email protected].
To post to this group, send email to [email protected].
To view this discussion on the web visit https://groups.google.com/a/continuum.io/d/msgid/bokeh/c573d9d6-89bd-4278-b544-bc1dc2dec05b%40continuum.io\.
For more options, visit https://groups.google.com/a/continuum.io/d/optout\.

ran into the same issue but it happened when I tried to add a line with a legend attached. I’m using bokeh 0.12.0, with the one alteration mentioned in the third post in this thread, as well as a small tweak to the slider’s javascript, but I doubt either of those are having an effect. The following code replicates the issue for me:

from random import randint

from bokeh.plotting import Figure,curdoc

from bokeh.models.widgets import Select,Button

from bokeh.models import HBox,VBox,WidgetBox, VBox,HoverTool, WidgetBox, Label, WheelZoomTool, SaveTool, PanTool

from bokeh.io import curdoc

def make_plot():

plot = Figure(x_axis_type="datetime", plot_width=700,tools=[HoverTool(tooltips=[("vol","$y"),("Date","@formDates")]),PanTool(),WheelZoomTool(),SaveTool()])

plot.background_fill_color='#EAEBF0'

plot.title.text = 'a title'

plot.xaxis.axis_label ='x axis'

plot.yaxis.axis_label = 'y axis'

return plot

def make_widgets(plot):

box = Select(title="Select",options=['a','b','c','d','e'])

box5 = Select(title="Other Select", options=[])

butt = Button(label = 'add some line')

x_values=None

y_values=None

def box_change(attrname,old,new):

	box5.options.append(new)

	box5.value = box5.options[0]

def box5_change(attrname,old,new):

	plot.title.text = "%s - %s" % (box.value,box5.value)

def butt_click():

	nonlocal x_values

	nonlocal y_values

	y_values=[]

	x_values=[]

	for i in range(30):

		x_values.append(i)

		y_values.append(randint(0,999))

	line = plot.line(x_values,y_values,legend=str(randint(0,50)))

	line.data_source.data['x']=x_values

	line.data_source.data['y']=y_values

box.on_change('value',box_change)

box5.on_change('value',box5_change)

butt.on_click(butt_click)

return [box,box5,butt]

plot = make_plot()

widgets = make_widgets(plot)

curdoc().add_root(VBox(HBox(WidgetBox(*widgets),VBox(plot,height=1200)),width=1200))