Hello!
As the title suggests I’m interested in adding labels to jittered data. There doesn’t seem to be an attribute to label individual jittered datapoints. Currently I’m just plotting the data and adding the labels after:
source = ColumnDataSource(both_df)
p.circle(x=jitter('Gene', .2), y='Value', color = 'Color', alpha=1,
            size='Size', source=source)
labels = LabelSet(x=jitter('Gene', .2), y='Value', text='Label', level='glyph',
              x_offset=.6, y_offset=.6, source=source, render_mode='canvas')
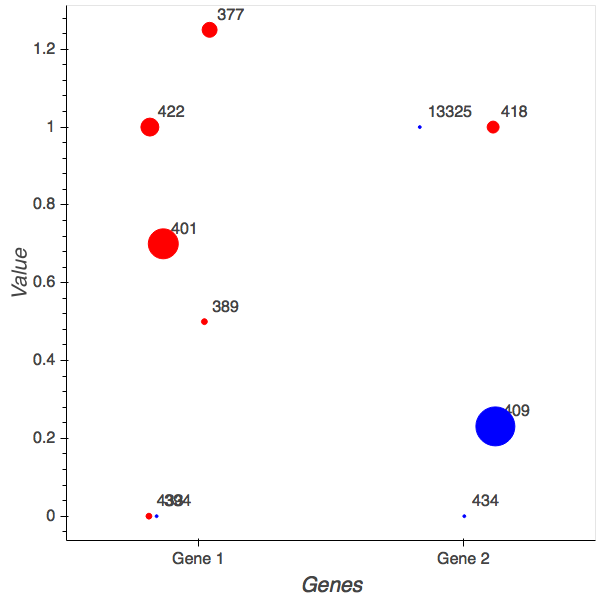
Which results in something like this:

Which you can see is a bit of a mess, and only gets worse as the jitter size increases. Is there a way I can label the jittered datapoints individually that way each label is by each point?
Thanks!