Greetings, I have written a simple code which helps me to create a Segment. Now, I want to add a Label to generated Segment .Below mentioned code is for drawing segment on double tap js event (p.js_on_event(‘doubletap’, callback)) .
I need assistance with label as shown in the image below:
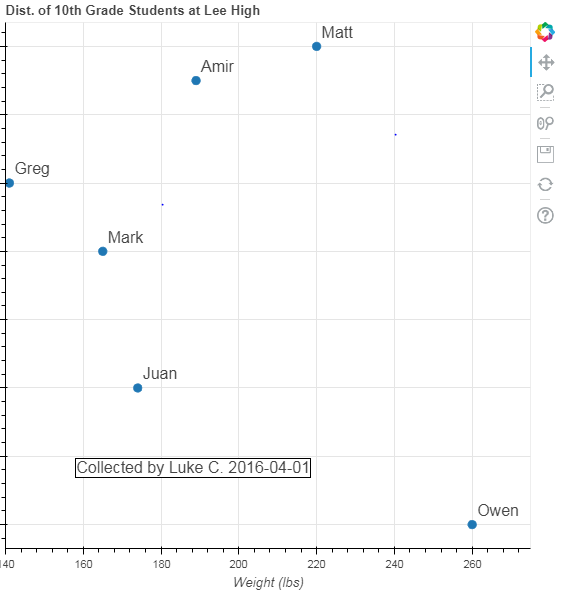
Your help would be really appreciated.
from bokeh.io import curdoc
from bokeh.layouts import row
from bokeh.models import ColumnDataSource, Segment, CustomJS, Line, CheckboxGroup

from bokeh.plotting import figure
from bokeh.models import PolyDrawTool, PolyEditTool

p = figure(x_range=(0, 10), y_range=(0, 10), width=400, height=400,  title='Label over Line')

checkbox_group = CheckboxGroup(labels=["fibo"], active=[1]) print(checkbox_group)
l1 = p.multi_line([], [], line_width =5, alpha= 0.4,  color='red', line_dash = 'dashed')
draw_tool_l1 = PolyDrawTool(renderers=[l1], num_objects=3)
source = ColumnDataSource(data=dict(x=[], y=[], x1= [], y1= []))
callback = CustomJS(args=dict(source=source), code="""


             if(source.data.x.length == 0){
                   source.data.x.push(cb_obj.x);
                   source.data.y.push(cb_obj.y);
             }else if(source.data.x.length == 1){
                   source.data.x1.push(cb_obj.x);
                   source.data.y1.push(cb_obj.y);
             }else {
                  source.data.x[1] = x0;
                  source.data.y[1] = y0;
             }


console.log('Tap event occurred at x-position: ' + cb_obj.x)
console.log('Tap event occurred at y-position: ' + cb_obj.y)
source.change.emit()

""")
multi_source = ColumnDataSource(data=dict(xs=[], ys=[]))

p.js_on_event('doubletap', callback)
s1 = Segment(x0='x',y0='y',x1='x1',y1='y1')

p.add_glyph(source, s1, selection_glyph=s1, nonselection_glyph=s1)

def update_flip(attrname, old, new):
# flip the *current* data on *every* button toggle
#source.data = dict(x=source.data['x'], y=flip_signal(source.data['y'], True))
print(new)

#checkbox_group.on_change("active", callback)

p.add_tools(draw_tool_l1)
layout = row(p, checkbox_group)
curdoc().add_root(layout)
Thank You.