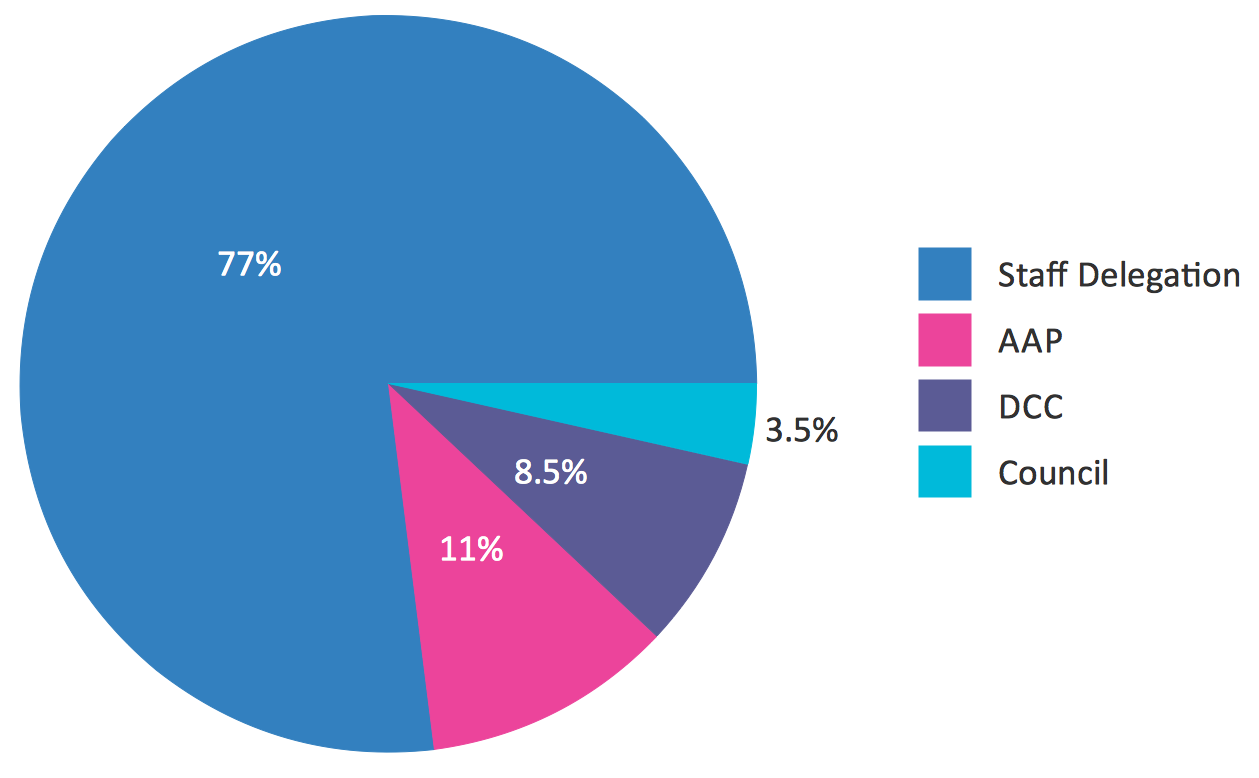
Is there a way to add a legend to a donut chart? I would like a chart like this (http://www.conceptdraw.com/How-To-Guide/picture/Percentage-pie-chart-DA-determinations.png - apologies if the image doesn’t show up properly):
Here’s what my current code looks like, but the labels don’t appear in the legend. I just started using bokeh, sorry if I’m missing something obvious!
def pie_chart(values, labels, title):
data[‘values’] = values
data[‘percents’] =
for amount in data[‘values’]:
data[‘percents’].append(’{:0.2f}’.format(100 * amount / sum(data[‘values’])))
data[‘labels’] = labels
donut = Donut(data, values=‘values’, legend=True, labels=labels, label=‘percents’, title=title)
show(donut)
pie_chart([2, 3], [‘a’,‘b’], ‘Test chart please ignore’)
``
oki
2
Do you have any solution yet?
···
On Friday, February 5, 2016 at 11:23:48 PM UTC+7, Achal Dave wrote:
Is there a way to add a legend to a donut chart? I would like a chart like this (http://www.conceptdraw.com/How-To-Guide/picture/Percentage-pie-chart-DA-determinations.png - apologies if the image doesn’t show up properly):
Here’s what my current code looks like, but the labels don’t appear in the legend. I just started using bokeh, sorry if I’m missing something obvious!
def pie_chart(values, labels, title):
data[‘values’] = values
data[‘percents’] =
for amount in data[‘values’]:
data[‘percents’].append(‘{:0.2f}’.format(100 * amount / sum(data[‘values’])))
data[‘labels’] = labels
donut = Donut(data, values=‘values’, legend=True, labels=labels, label=‘percents’, title=title)
show(donut)
pie_chart([2, 3], [‘a’,‘b’], ‘Test chart please ignore’)
``
Bryan
3
For simple Pie charts, I'd recommend just using the "wedge" glyph method in bokeh.plotting instead, if you need a legend:
http://bokeh.pydata.org/en/latest/docs/user_guide/plotting.html#wedges-and-arcs
Thanks,
Bryan
···
On Mar 20, 2017, at 10:14, [email protected] wrote:
Do you have any solution yet?
On Friday, February 5, 2016 at 11:23:48 PM UTC+7, Achal Dave wrote:
Is there a way to add a legend to a donut chart? I would like a chart like this (http://www.conceptdraw.com/How-To-Guide/picture/Percentage-pie-chart-DA-determinations.png - apologies if the image doesn't show up properly):
Here's what my current code looks like, but the labels don't appear in the legend. I just started using bokeh, sorry if I'm missing something obvious!
def pie_chart(values, labels, title):
data['values'] = values
data['percents'] =
for amount in data['values']:
data['percents'].append('{:0.2f}'.format(100 * amount / sum(data['values'])))
data['labels'] = labels
donut = Donut(data, values='values', legend=True, labels=labels, label='percents', title=title)
show(donut)
pie_chart([2, 3], ['a','b'], 'Test chart please ignore')
--
You received this message because you are subscribed to the Google Groups "Bokeh Discussion - Public" group.
To unsubscribe from this group and stop receiving emails from it, send an email to [email protected].
To post to this group, send email to [email protected].
To view this discussion on the web visit https://groups.google.com/a/continuum.io/d/msgid/bokeh/eb7ba94d-20f0-424a-8084-adb1862e6e80%40continuum.io\.
For more options, visit https://groups.google.com/a/continuum.io/d/optout\.
