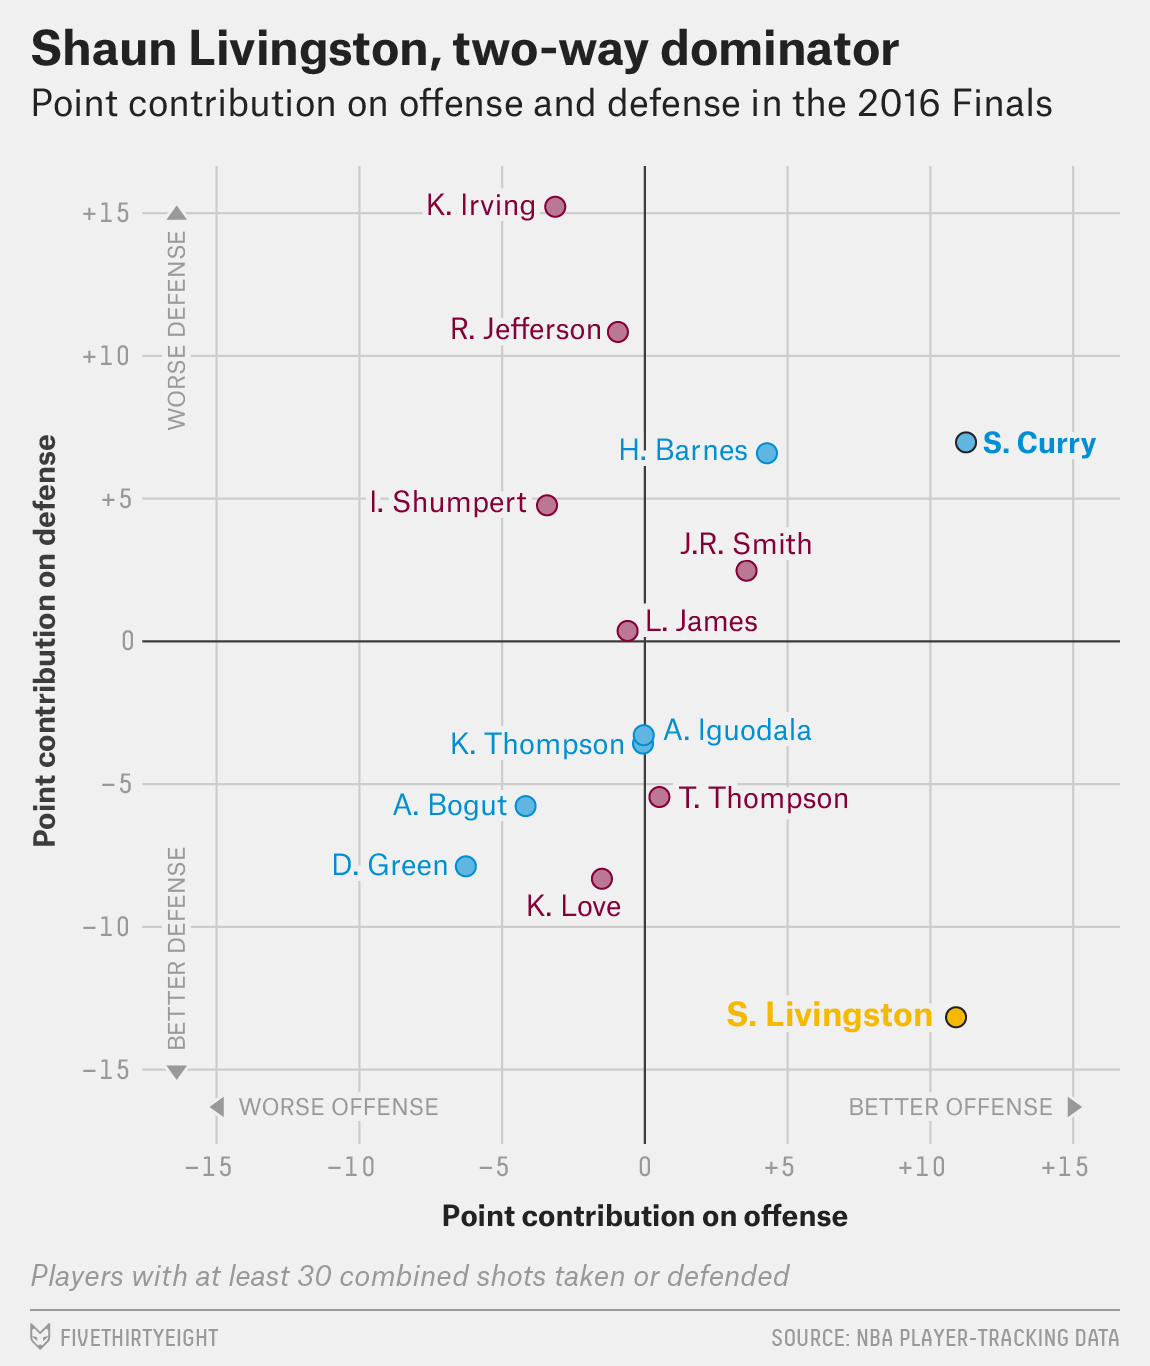
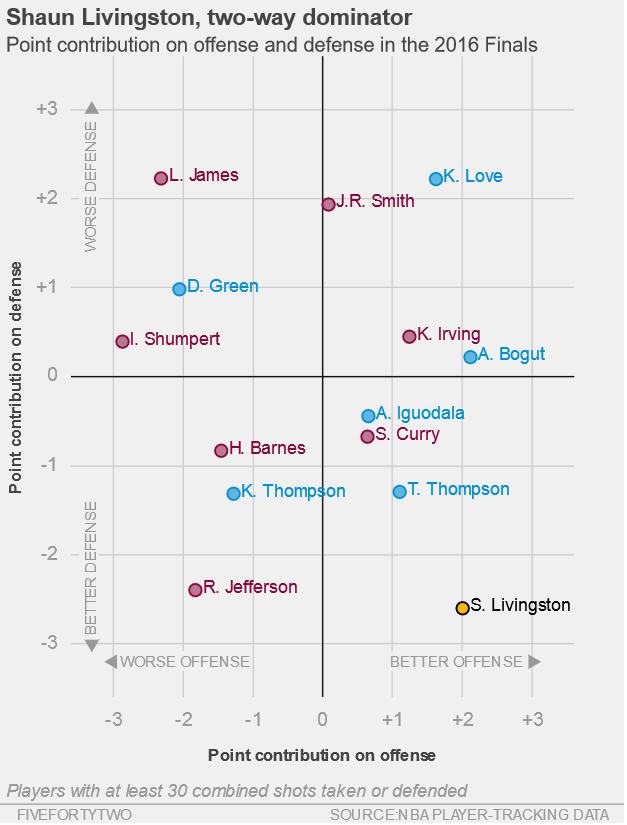
In order to familiarize myself with Bokeh, tried to replicate this basic 538 visualization (http://i1.wp.com/espnfivethirtyeight.files.wordpress.com/2016/06/morris-finalsmvp-2.png?quality=90&strip=all&w=1150&ssl=1), with the target of eventually adding interactivity to the chart after recreating it.
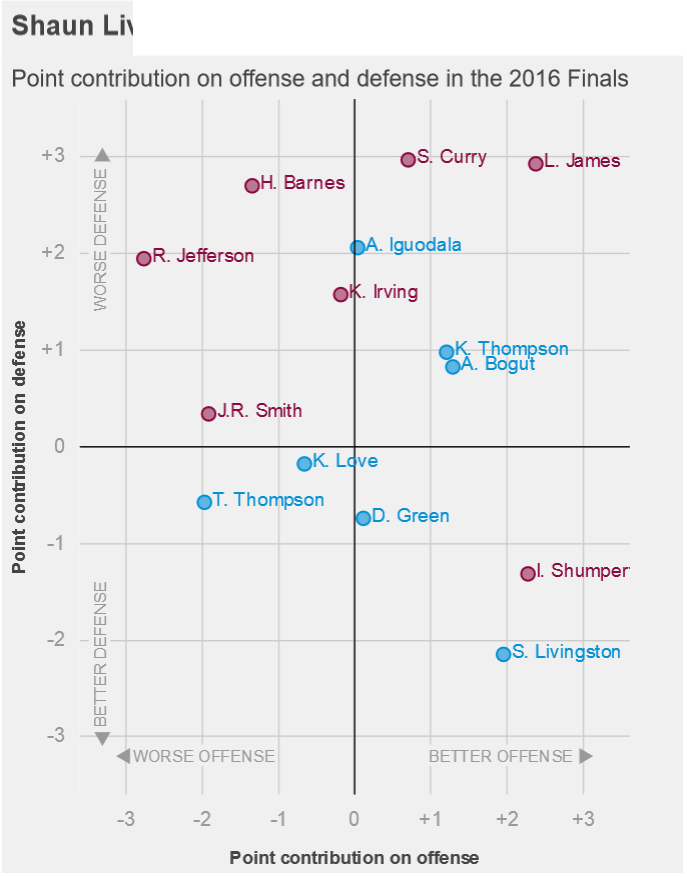
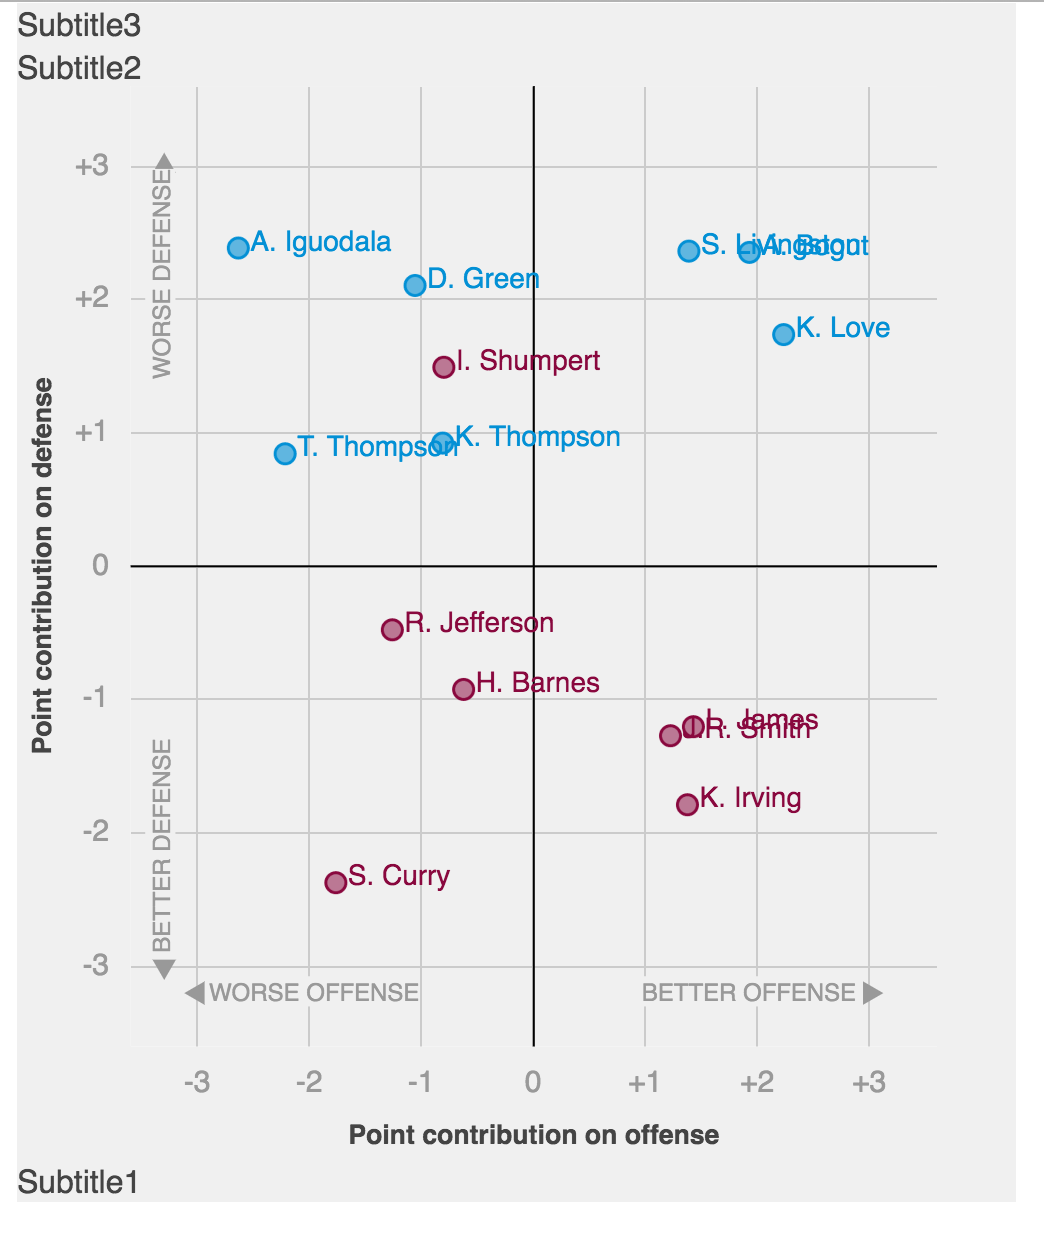
While I was able to recreate most of it: My attempt(http://imgur.com/a/JZPZ7) , I’m facing some issues with adding things outside of the chart. Now, I know that it is easy to add these elements separately while embedding by adding a few HTML elements, but I want to know if there is a way to do the whole thing in Bokeh itself. Here is a summary of the problems I’m facing:
a) Is there a way to add subtitles to plots? If not, is there anyway I can put two figures in a column container and have one of them only contain text so that it can act as the main title? I tried doing it but irrespective of what sizing mode and width parameters I chose, the top figure kept getting cut off (as you can see in my attempt pic). Here is the code snippet I’m using. ‘q’ is the heading-only figure atop p, which contains everything else:
# Figure 'p''s dimensions are 600 X 500, so I put width for q = 500
q = figure(width=500, height=40, background_fill_color='#F0F0F0',
          title='Shaun Livingston, two-way dominator')
q.toolbar_location=None
q.title.text_font_size='20px'
q.title.offset=-50.0

l = column(q,p,sizing_mode='fixed')
show(l)
b) If you have a look at the original visualization, there is also some text content at the very bottom. Is it possible to add text outside chart area in Bokeh? In Matplotlib, there is figtext and in fact, just plt.text with data coordinates outside the main chart also works. In Bokeh though, that does not happen and the text does not appear if I try to place it outside chart area (Using Label/LabelSet). Is there a workaround?
c) Similarly, is it possible to add lines outside the chart area? Like matplotlib’s axhline, axvline.
d) What’s the ‘zorder’ like variable in Bokeh? If I want the span lines to appear below the circle glyphs, what alteration do I need to make to the code?
I really enjoyed creating the rest of the chart and the new annotation options were extremely helpful. Thanks!