Thanks for the prompt response. However, still struggling to make it work properly:
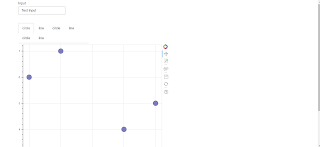
See below code (self-contained). As you can see in the image the tab labels are not extending outwards in one row but rather creating another row of labels when really I want all the panel labels to be on the same horizontal plane to conserve vertical space.
`
from bokeh.models.widgets import Panel, Tabs, TextInput
from bokeh.io import output_file, show
from bokeh.plotting import figure
from bokeh.layouts import column, row

output_file("slider.html")

textInput = TextInput(value="Text Input", title='Input')

p1 = figure()
p1.circle([1, 2, 3, 4, 5], [6, 7, 2, 4, 5], size=20, color="navy", alpha=0.5)
tab1 = Panel(child=p1, title="circle")

p2 = figure()
p2.line([1, 2, 3, 4, 5], [6, 7, 2, 4, 5], line_width=3, color="navy", alpha=0.5)
tab2 = Panel(child=p2, title="line")

p3 = figure()
p3.circle([1, 2, 3, 4, 5], [6, 7, 2, 4, 5], size=20, color="navy", alpha=0.5)
tab3 = Panel(child=p3, title="circle")

p4 = figure()
p4.line([1, 2, 3, 4, 5], [6, 7, 2, 4, 5], line_width=3, color="navy", alpha=0.5)
tab4 = Panel(child=p4, title="line")

p5 = figure()
p5.circle([1, 2, 3, 4, 5], [6, 7, 2, 4, 5], size=20, color="navy", alpha=0.5)
tab5 = Panel(child=p5, title="circle")

p6 = figure()
p6.line([1, 2, 3, 4, 5], [6, 7, 2, 4, 5], line_width=3, color="navy", alpha=0.5)
tab6 = Panel(child=p6, title="line")

tabs = Tabs(tabs=[ tab1, tab2 , tab3, tab4, tab5, tab6], sizing_mode='stretch_both')
layout = column(row(textInput), tabs)

show(layout)
`
···
On Tuesday, November 28, 2017 at 10:29:41 AM UTC-8, Eugene Pakhomov wrote:
Hi,
No, for this you’ll have to use column() and row() functions.
Regards,
Eugene
On Wednesday, November 29, 2017 at 1:24:14 AM UTC+7, Harrison wrote:
Is there a way to adjust row heights when using layout()?
I want something like the gridplot seen in the documentation: https://bokeh.pydata.org/en/latest/docs/user_guide/layout.html#general-grid-layout
However, I’d like one of the rows to be much shorter (as it only holds a list of widgets in it) and then the other rows larger. Currently, I cannot get it to work therefore my first row has a lot of unnecessary white-space. thanks
